


Profiling PyTorch workloads with The Instrumentation and Tracing Technology (ITT) API
Created On: Oct 27, 2022 | Last Updated: Oct 24, 2024 | Last Verified: Not Verified
In this recipe, you will learn:
What is Intel® VTune™ Profiler
What is Instrumentation and Tracing Technology (ITT) API
How to visualize PyTorch model hierarchy in Intel® VTune™ Profiler
A short sample code showcasing how to use PyTorch ITT APIs
Requirements
PyTorch 1.13 or later
Intel® VTune™ Profiler
The instructions for installing PyTorch are available at pytorch.org.
What is Intel® VTune™ Profiler
Intel® VTune™ Profiler is a performance analysis tool for serial and multithreaded applications. For those who are familiar with Intel Architecture, Intel® VTune™ Profiler provides a rich set of metrics to help users understand how the application executed on Intel platforms, and thus have an idea where the performance bottleneck is.
More detailed information, including a Getting Started guide, are available on the Intel website.
What is Instrumentation and Tracing Technology (ITT) API
The Instrumentation and Tracing Technology API (ITT API) provided by the Intel® VTune™ Profiler enables target application to generate and control the collection of trace data during its execution.
The advantage of ITT feature is to label time span of individual PyTorch operators, as well as customized regions, on Intel® VTune™ Profiler GUI. When users find anything abnormal, it will be very helpful to locate which operator behaved unexpectedly.
Note
The ITT API had been integrated into PyTorch since 1.13. Users don’t need to invoke the original ITT C/C++ APIs, but only need to invoke the Python APIs in PyTorch. More detailed information can be found at PyTorch Docs.
How to visualize PyTorch model hierarchy in Intel® VTune™ Profiler
Two types of usage are provided in PyTorch:
Implicit invocation: By default, all operators that are registered by following the PyTorch operator registration mechanism will be labeled by ITT feature automatically when its feature is enabled.
Explicit invocation: If customized labeling is needed, users can use APIs mentioned at PyTorch Docs explicitly to label a desired range.
To enable explicit invocation, code which are expected to be labeled should be invoked under a torch.autograd.profiler.emit_itt() scope. For example:
with torch.autograd.profiler.emit_itt():
  <code-to-be-profiled...>
Launch Intel® VTune™ Profiler
To verify the functionality, you need to start an Intel® VTune™ Profiler instance. Please check the Intel® VTune™ Profiler User Guide for steps to launch Intel® VTune™ Profiler.
Note
Users can also use web-server-ui by following Intel® VTune™ Profiler Web Server UI Guide ex : vtune-backend –web-port=8080 –allow-remote-access –enable-server-profiling
Once you get the Intel® VTune™ Profiler GUI launched, you should see a user interface as below:
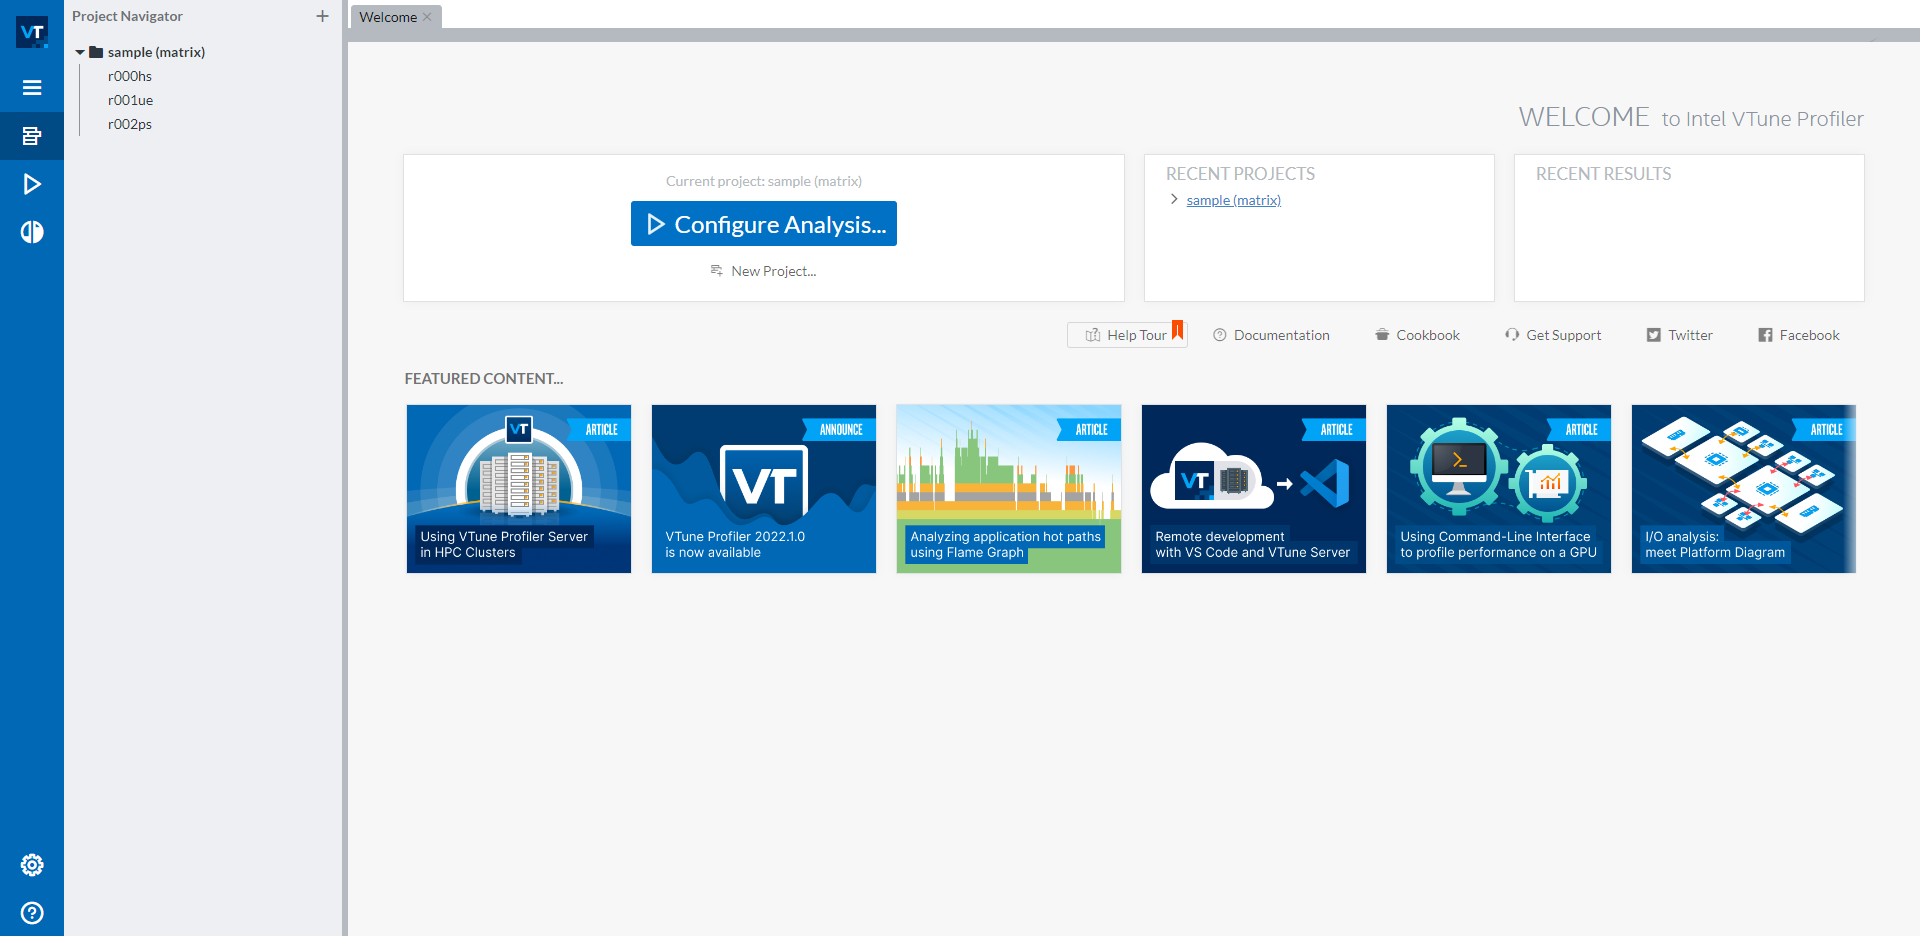
Three sample results are available on the left side navigation bar under sample (matrix) project. If you do not want profiling results appear in this default sample project, you can create a new project via the button New Project… under the blue Configure Analysis… button. To start a new profiling, click the blue Configure Analysis… button to initiate configuration of the profiling.
Configure Profiling for CPU
Once you click the Configure Analysis… button, you should see the screen below:
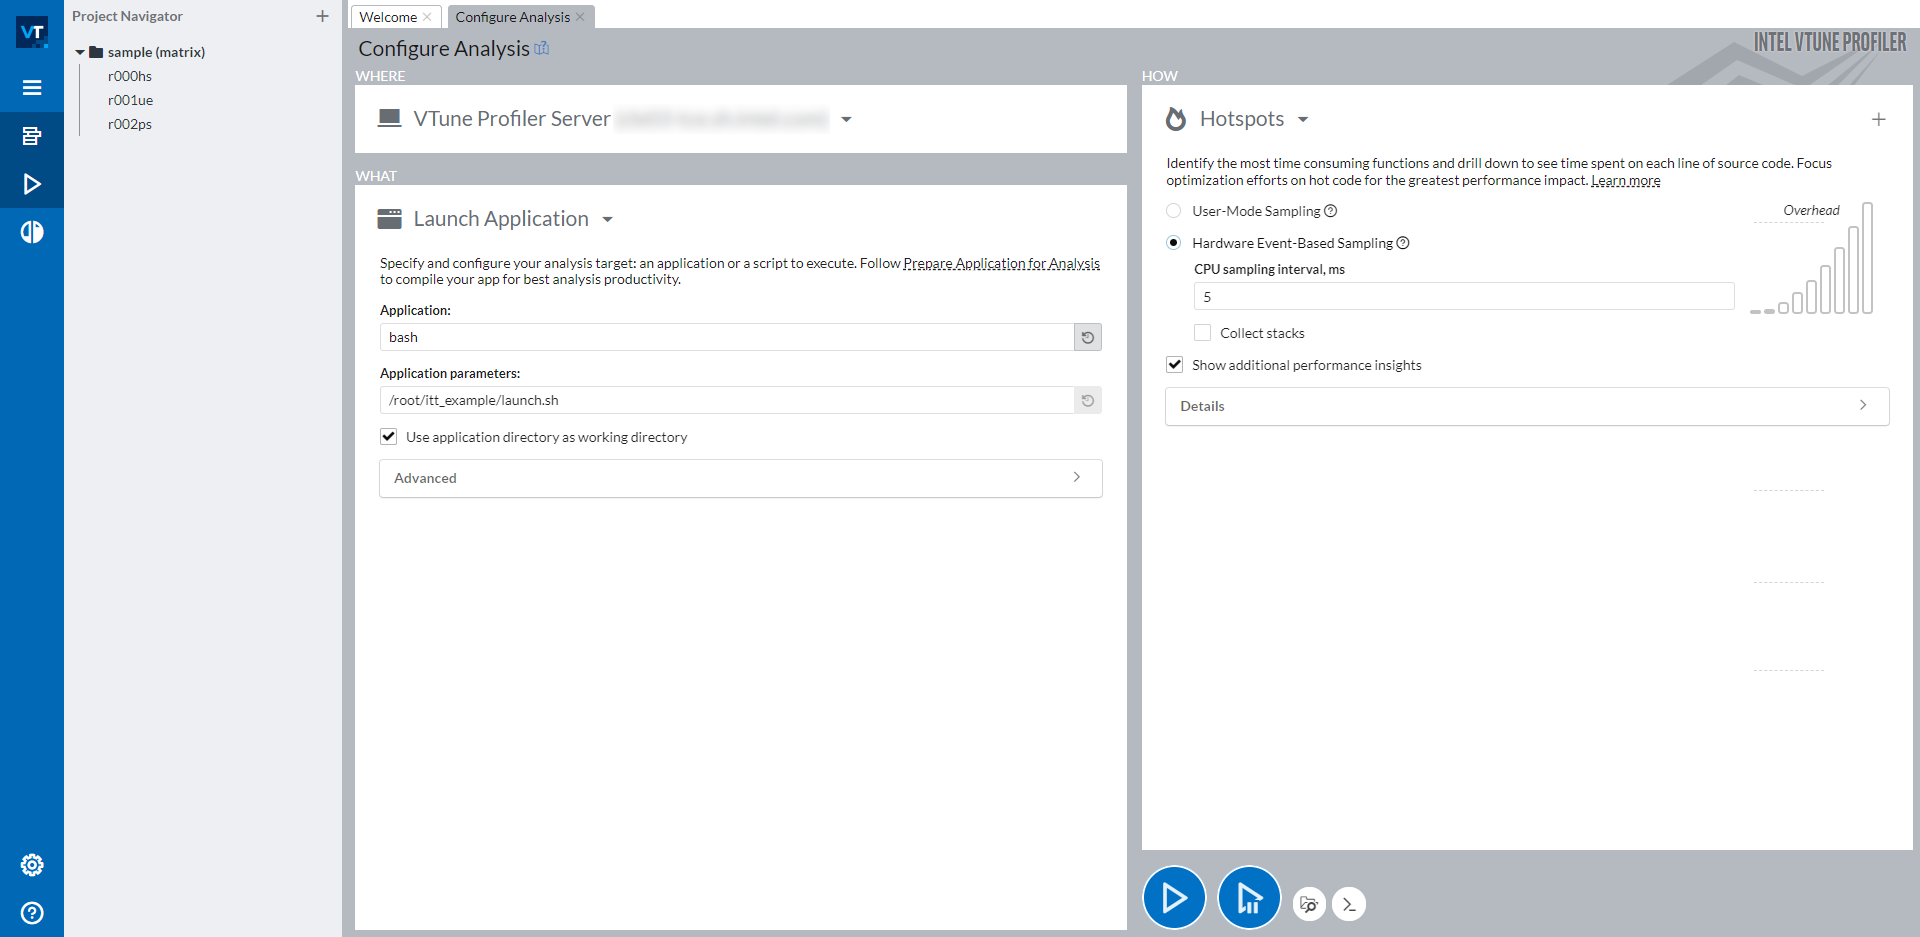
The right side of the windows is split into 3 parts: WHERE (top left), WHAT (bottom left), and HOW (right). With WHERE, you can assign a machine where you want to run the profiling on. With WHAT, you can set the path of the application that you want to profile. To profile a PyTorch script, it is recommended to wrap all manual steps, including activating a Python environment and setting required environment variables, into a bash script, then profile this bash script. In the screenshot above, we wrapped all steps into the launch.sh bash script and profile bash with the parameter to be <path_of_launch.sh>. On the right side HOW, you can choose whatever type that you would like to profile. Intel® VTune™ Profiler provides a bunch of profiling types that you can choose from. Details can be found at Intel® VTune™ Profiler User Guide.
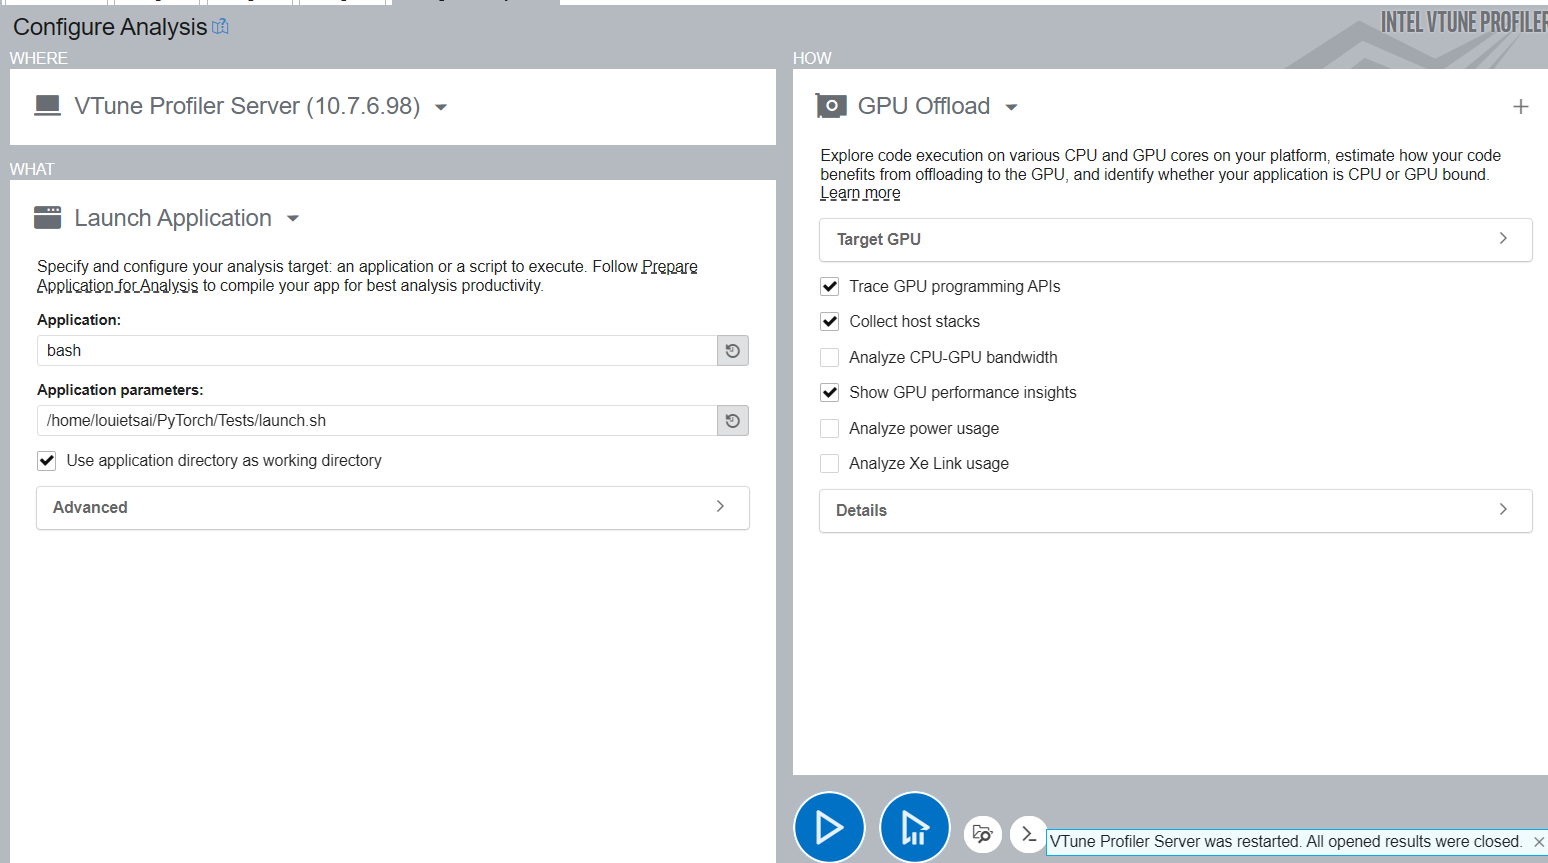
Configure Profiling for XPU
Pick GPU Offload Profiling Type instead of Hotspots, and follow the same instructions as CPU to Launch the Application.
Read Profiling Result
With a successful profiling with ITT, you can open Platform tab of the profiling result to see labels in the Intel® VTune™ Profiler timeline.
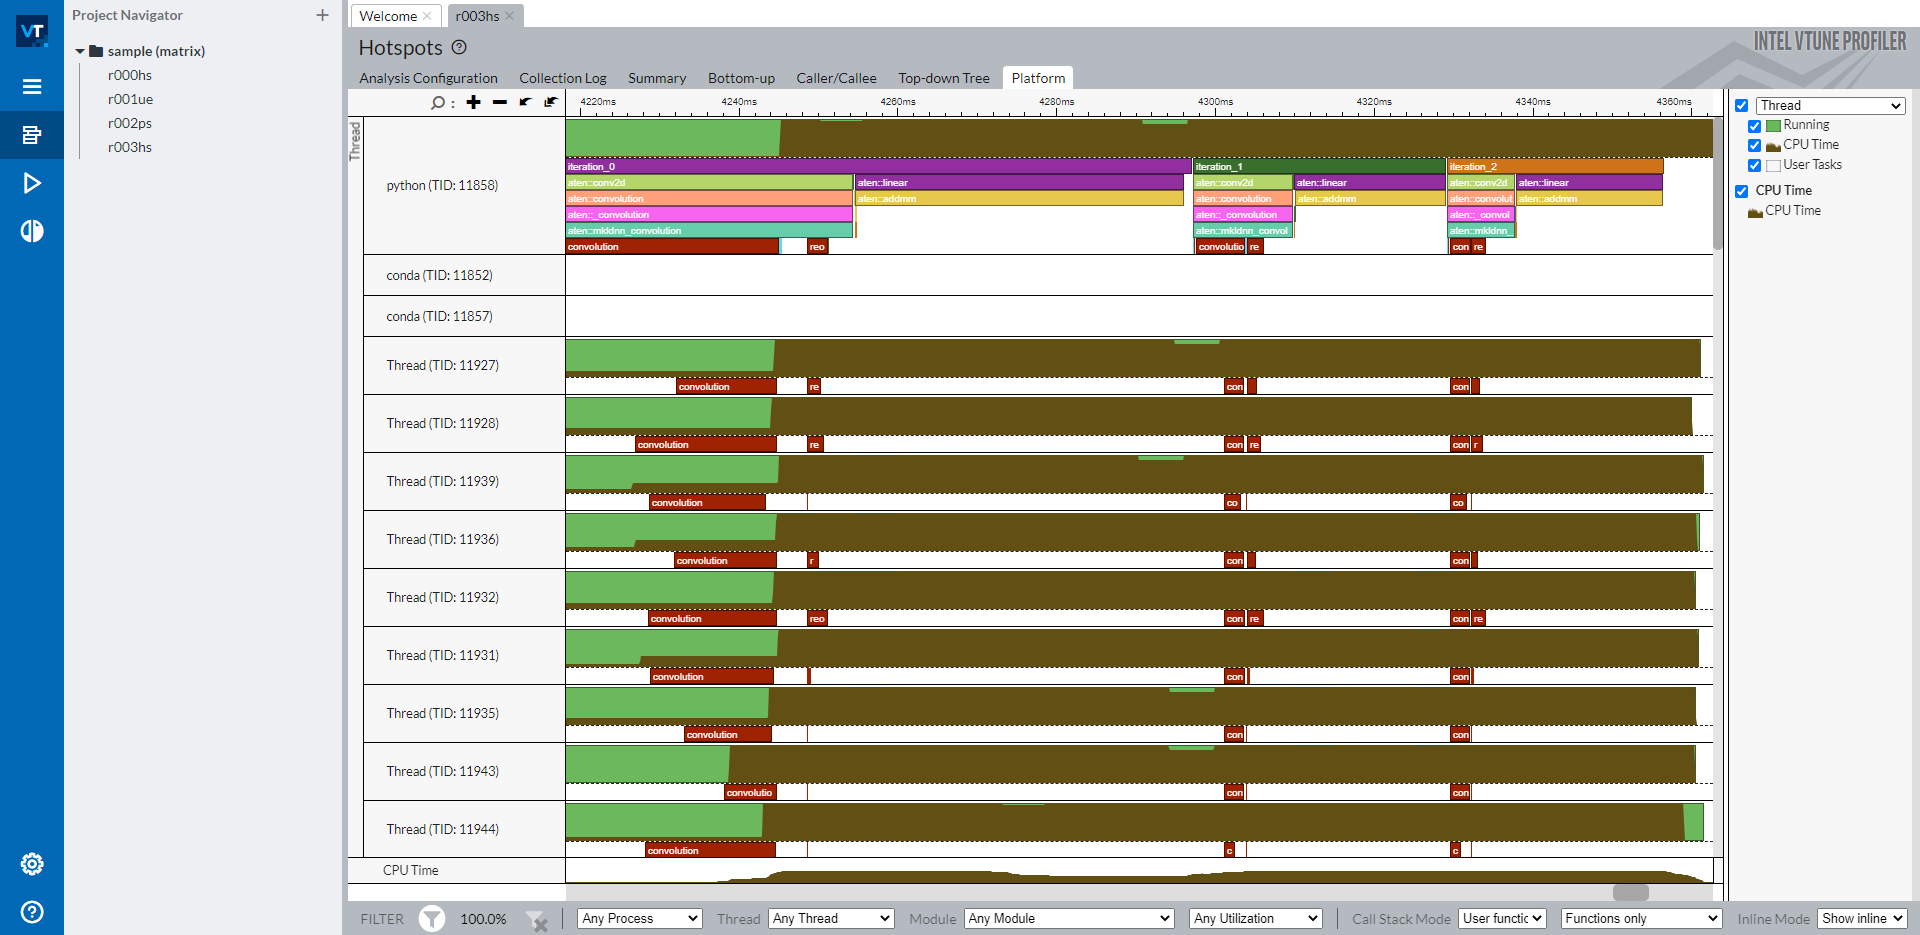
The timeline shows the main thread as a python thread on the top, and individual OpenMP threads below. Labeled PyTorch operators and customized regions are shown in the main thread row. All operators starting with aten:: are operators labeled implicitly by the ITT feature in PyTorch. Labels iteration_N are explicitly labeled with specific APIs torch.profiler.itt.range_push(), torch.profiler.itt.range_pop() or torch.profiler.itt.range() scope. Please check the sample code in the next section for details.
Note
Red boxes marked with convolution and reorder are labeled from Intel® oneAPI Deep Neural Network Library (oneDNN).
As illustrated on the right side navigation bar, brown portions in the timeline rows show CPU usage of individual threads. The percerntage of height of a thread row that the brown portion occupies at a timestamp aligns with that of the CPU usage in that thread at that timestamp. Thus, it is intuitive from this timeline to understand the followings:
How well CPU cores are utilized on each thread.
How balance CPU cores are utilized on all threads. Do all threads have good CPU usage?
How well OpenMP threads are synchronized. Are there jitters when starting OpenMP threads or OpenMP threads finish.
Of course there are much more enriched sets of profiling features that Intel® VTune™ Profiler provides to help you understand a performance issue. When you understand the root cause of a performance issue, you can get it fixed. More detailed usage instructions are available at Intel® VTune™ Profiler User Guide.
Read XPU Profiling Result
With a successful profiling with ITT, you can open Platform tab of the profiling result to see labels in the Intel® VTune™ Profiler timeline.
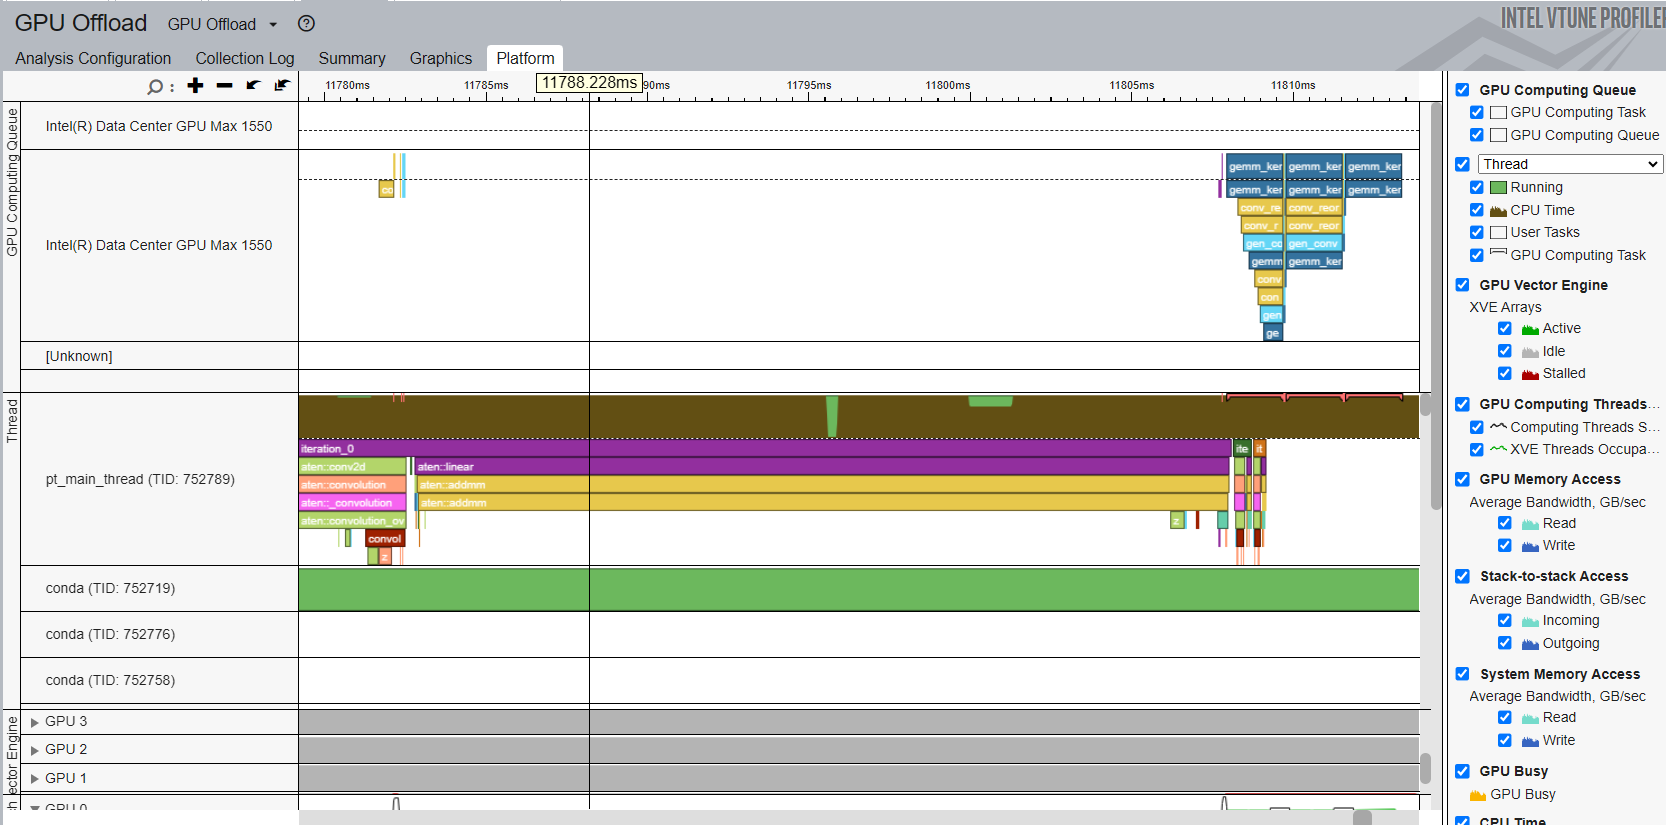
The timeline shows the main thread as a python thread on the top. Labeled PyTorch operators and customized regions are shown in the main thread row. All operators starting with aten:: are operators labeled implicitly by the ITT feature in PyTorch. The timeline also shows the GPU Computing Queue on the top, and users could see different XPU Kernels dispatched into GPU Queue.
A short sample code showcasing how to use PyTorch ITT APIs
The sample code below is the script that was used for profiling in the screenshots above.
The topology is formed by two operators, Conv2d and Linear. Three iterations of inference were performed. Each iteration was labeled by PyTorch ITT APIs as text string iteration_N. Either pair of torch.profile.itt.range_push and torch.profile.itt.range_pop or torch.profile.itt.range scope does the customized labeling feature.
# sample.py

import torch
import torch.nn as nn

class ITTSample(nn.Module):
  def __init__(self):
    super(ITTSample, self).__init__()
    self.conv = nn.Conv2d(3, 5, 3)
    self.linear = nn.Linear(292820, 1000)

  def forward(self, x):
    x = self.conv(x)
    x = x.view(x.shape[0], -1)
    x = self.linear(x)
    return x

def main():
  m = ITTSample
  # unmark below code for XPU
  # m = m.to("xpu")
  x = torch.rand(10, 3, 244, 244)
  # unmark below code for XPU
  # x = x.to("xpu")
  with torch.autograd.profiler.emit_itt():
    for i in range(3)
      # Labeling a region with pair of range_push and range_pop
      #torch.profiler.itt.range_push(f'iteration_{i}')
      #m(x)
      #torch.profiler.itt.range_pop()

      # Labeling a region with range scope
      with torch.profiler.itt.range(f'iteration_{i}'):
        m(x)

if __name__ == '__main__':
  main()
The launch.sh bash script, mentioned in the Intel® VTune™ Profiler GUI screenshot, to wrap all manual steps is shown below.
# launch.sh

#!/bin/bash

# Retrieve the directory path where the path contains both the sample.py and launch.sh so that this bash script can be invoked from any directory
BASEFOLDER=$( cd -- "$( dirname -- "${BASH_SOURCE[0]}" )" &> /dev/null && pwd )
<Activate a Python environment>
cd ${BASEFOLDER}
python sample.py
