torch.meshgrid
- torch.meshgrid(*tensors, indexing=None)[source][source]
Creates grids of coordinates specified by the 1D inputs in attr:tensors.
This is helpful when you want to visualize data over some range of inputs. See below for a plotting example.
Given 1D tensors as inputs with corresponding sizes , this creates N-dimensional tensors , each with shape where the output is constructed by expanding to the result shape.
Note
0D inputs are treated equivalently to 1D inputs of a single element.
Warning
torch.meshgrid(*tensors) currently has the same behavior as calling numpy.meshgrid(*arrays, indexing=’ij’).
In the future torch.meshgrid will transition to indexing=’xy’ as the default.
https://github.com/pytorch/pytorch/issues/50276 tracks this issue with the goal of migrating to NumPy’s behavior.
See also
torch.cartesian_prod()has the same effect but it collects the data in a tensor of vectors.- Parameters
tensors (list of Tensor) – list of scalars or 1 dimensional tensors. Scalars will be treated as tensors of size automatically
(str, optional): the indexing mode, either “xy” or “ij”, defaults to “ij”. See warning for future changes.
If “xy” is selected, the first dimension corresponds to the cardinality of the second input and the second dimension corresponds to the cardinality of the first input.
If “ij” is selected, the dimensions are in the same order as the cardinality of the inputs.
- Returns
If the input has tensors of size , then the output will also have tensors, where each tensor is of shape .
- Return type
seq (sequence of Tensors)
Example:
>>> x = torch.tensor([1, 2, 3])
>>> y = torch.tensor([4, 5, 6])

Observe the element-wise pairings across the grid, (1, 4),
(1, 5), ..., (3, 6). This is the same thing as the
cartesian product.
>>> grid_x, grid_y = torch.meshgrid(x, y, indexing='ij')
>>> grid_x
tensor([[1, 1, 1],
        [2, 2, 2],
        [3, 3, 3]])
>>> grid_y
tensor([[4, 5, 6],
        [4, 5, 6],
        [4, 5, 6]])

This correspondence can be seen when these grids are
stacked properly.
>>> torch.equal(torch.cat(tuple(torch.dstack([grid_x, grid_y]))),
...             torch.cartesian_prod(x, y))
True

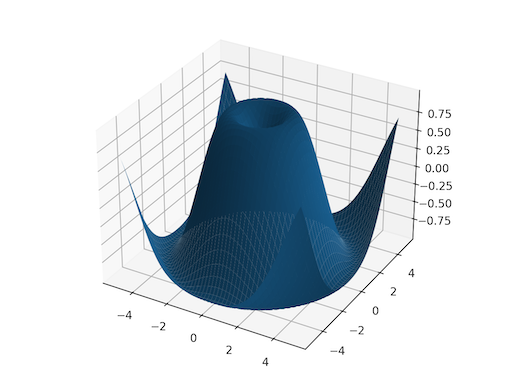
`torch.meshgrid` is commonly used to produce a grid for
plotting.
>>> import matplotlib.pyplot as plt
>>> xs = torch.linspace(-5, 5, steps=100)
>>> ys = torch.linspace(-5, 5, steps=100)
>>> x, y = torch.meshgrid(xs, ys, indexing='xy')
>>> z = torch.sin(torch.sqrt(x * x + y * y))
>>> ax = plt.axes(projection='3d')
>>> ax.plot_surface(x.numpy(), y.numpy(), z.numpy())
>>> plt.show()

