In this blog, we share how we enabled the collection and analysis of PyTorch Profiler traces for training workloads without any user side code instrumentation. We leveraged Dynolog – an open source daemon for CPU and GPU telemetry to collect PyTorch Profiler traces, and analyzed the collected traces using Holistic Trace Analysis – an open source library for analyzing PyTorch Profiler traces. This toolchain has allowed engineers at Meta to accelerate their performance optimization workflows. The keystone to our solution was implementing pre and post hooks for the base Optimizer class in PyTorch. We demo PyTorch trace collection using Dynolog in a short video.
Problem
Software developers at Meta run a large number of distributed training runs daily. In order to ensure that GPUs are being used effectively it is necessary to measure and analyze GPU performance for all jobs. Moreover, developers need the capability to introspect models and understand how CPUs and GPUs interact to debug performance issues. Developers build initial prototypes using a handful of GPUs and the production versions scale out to hundreds or thousands of GPUs, serving numerous business use cases such as generative AI, recommendation systems, ad ranking etc.
Given the scale at Meta, it is necessary to have toolchains for performance measurement and monitoring which have low overhead and operate seamlessly with each other, to maintain high developer efficiency.
In this blog, we describe how we use the PyTorch Profiler, Dynolog (a telemetry daemon) and Holistic Trace Analysis (a performance debugging library) to collect traces without any user side code instrumentation and analyze them to identify jobs with low GPU utilization.
Solution
The diagram below shares an overview of how the toolchain works together.
- User launches a PyTorch application.
- A training service or user triggers a profiling session using the Dynolog CLI which sends a request over the network to the Dynolog daemon.
- Dynolog daemon relays the profiling configuration to the PyTorch application, setting it temporarily in a profiling mode.
- PyTorch Profiler collects a trace and stores it to the database (e.g., network file system or S3 bucket).
- The collected traces are then analyzed using Holistic Trace Analysis (HTA).
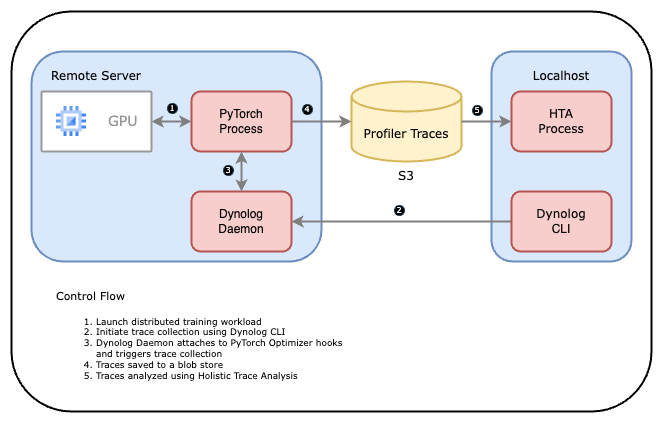
Figure 1: Dynolog, PyTorch Profiler and HTA toolchain workflow
Let’s dig a bit deeper in each of the components.
Dynolog
Dynolog is a lightweight monitoring daemon for heterogeneous CPU-GPU systems. It supports continuous monitoring of performance metrics from the CPU (utilization, network bandwidth, instructions/second) and GPU (SM Occupancy, DRAM bandwidth, GPU power draw). Additionally, dynolog exports APIs to collect deep-dive profiling data that can be accessed via the dyno CLI.
One of the chief integrations Dynolog offers is interfacing with the PyTorch Profiler. This enables on-demand remote tracing using a single command to trace thousands of servers. This can be accomplished by using the dyno gputrace command.
PyTorch Profiler
GPU kernels execute asynchronously, and GPU-side support is needed to create the trace. NVIDIA provides this visibility via the CUPTI library. Kineto is the subsystem within Profiler that interfaces with CUPTI. The PyTorch Profiler leverages the Kineto library to collect GPU traces. To enable automated profiling of training workloads at scale without any user side code instrumentation we made a few fundamental changes to PyTorch. These changes enable trace collection without any user intervention.
- Registration:** **First, we modified PyTorch to register with the Dynolog daemon on start up. This feature is switched on by setting the environment variable KINETO_USE_DAEMON=True. With this environment variable set to True, the PyTorch Profiler periodically polls Dynolog to check for on-demand tracing requests.
- Iteration hooks: Then, we implemented pre and post hooks for the base Optimizer class. This allowed us to annotate start/end of training iterations. The profiler is then aware of the iteration count and can safely capture a fixed number of iterations in the trace.
Holistic Trace Analysis (HTA)
ML researchers and engineers often struggle to computationally scale up their models as they are unaware of the performance bottlenecks in their workloads. Large distributed training jobs could generate thousands of traces, containing way too much data for a human to inspect. This is where Holistic Trace Analysis comes in. HTA is an open source library for performance analysis – it takes as input PyTorch Profiler traces and up-levels the performance information contained in them. Its goal is to help researchers and engineers achieve the best performance from the hardware stack. To aid performance debugging HTA provides the following features (partial list):
- Temporal Breakdown: Breakdown of GPU time in terms of time spent in computation, communication, memory events, and idle time on a single node and across all ranks.
- Idle Time Breakdown: Breakdown of GPU idle time into waiting for the host, waiting for another kernel or attributed to an unknown cause.
- Kernel Breakdown: Find kernels with the longest duration on each rank.
- Kernel Duration Distribution: Distribution of average time taken by longest kernels across different ranks.
- Communication Computation Overlap: Calculate the percentage of time when communication overlaps computation.
We invite you to check out these Jupyter notebooks to see what HTA can do for you. If you are a first time user we recommend starting with the trace_analysis_demo notebook.
To summarize, Dynolog allows us to collect PyTorch Profiler traces on-the-fly in a scalable manner. Furthermore, by leveraging HTA we can automate performance analysis and identify bottlenecks. At Meta, we use the Dynolog, PyTorch Profiler and HTA toolchain to accelerate our performance optimization workflows.
Demo
We share a screencast showcasing trace collection without any user side code instrumentation for a toy PyTorch program. The demo runs in a docker container and the trace collection is triggered using Dynolog. HTA can be used to subsequently analyze the collected trace.
FAQs
Q. What else can dyno gputrace do for me?
The dyno gputrace command supports several custom PyTorch Profiler options:
- capturing python stacks
- memory profiling
- record input shapes
Please run dyno gputrace --help for all the options.
Q. Does Dynolog collect hardware performance metrics?
Dynolog can also be used for always-on monitoring:
- It incorporates out-of-box GPU performance monitoring for NVIDIA GPUs using DCGM.
- Dynolog provides basic Linux kernel performance metrics including CPU, network and IO resource usage.
- Dynolog manages hardware performance counters for micro-architecture specific events related to CPU Cache, TLBs etc on Intel and AMD CPUs.
Q: How can I build the Docker image used in the demo?
The dockerfile is available here. Use the command below to build the Docker image.
docker build -f /path/to/dynolog_repo/dynolog_hta.dockerfile -t <image_name:tag> .
Q. How can I run the docker image?
You can refer to this cheat sheet to run the Docker image.