We are excited to announce the public release of Holistic Trace Analysis (HTA), an open source performance analysis and visualization Python library for PyTorch users. HTA takes as input Kineto traces collected by the PyTorch profiler, which are complex and challenging to interpret, and up-levels the performance information contained in these traces. It was initially developed internally at Meta to understand and debug performance problems for large-scale distributed training jobs on GPUs. The multidisciplinary team has made a number of enhancements to HTA’s features and scaled them to support state-of-the-art ML workloads.
ML researchers and systems engineers often struggle to computationally scale up their models because they are not aware of the performance bottlenecks in their workloads. The resources requested for a job (e.g. GPUs, memory) are often misaligned with the resources actually required due to lack of visibility “under the hood”. To achieve the best performance from the hardware stack, it is imperative to understand the resource utilization and bottlenecks for distributed training workloads.
The initial HTA implementation was specifically targeted at Deep Learning Based Recommendation Models (DLRM). To make the features in HTA generic and applicable to use cases such as analyzing Vision and NLP models, we decided to refactor the HTA codebase and make the library available to the larger community. This new codebase has implemented several important ideas which lead to significant efficiency and performance improvements.
In this blog, we present several features implemented in the open source version of HTA, which can be used as a Python script as well as interactively in a Jupyter notebook. HTA provides the following features:
- Breakdown by Dimensions
- Temporal: Breakdown of GPU time in terms of time spent in computation, communication, memory events, and idle time on a single node and across all ranks.
- Idle Time: Breakdown of GPU idle time into waiting for the host, waiting for another kernel or attributed to an unknown cause.
- Kernel: Find kernels with the longest duration on each rank.
- Communication Computation Overlap: Calculate the percentage of time when communication overlaps computation.
- Statistical Analysis
- Kernel Duration Distribution: Distribution of average time taken by longest kernels across different ranks.
- CUDA Kernel Launch: Distributions of GPU kernels with very small duration, large duration, and excessive launch time.
- Augmented Counters (Memory bandwidth, Queue length): Augmented trace files which provide insights into memory copy bandwidth and number of outstanding operations on each CUDA stream.
- Patterns
- Frequent CUDA Kernels: Find the CUDA kernels most frequently launched by any given PyTorch or user defined operator.
- Trace Comparison
- Trace Diff: A trace comparison tool to identify and visualize the differences between traces.
HTA source code is available to users via Github. Users can request new features or build their own analysis using the core libraries and data structures provided in the codebase in addition to the features mentioned above.
GPU Training Performance Debugging 101
To understand the GPU performance in distributed training jobs, we consider how the model operators interact with the GPU devices and how such interactions are reflected in certain measurable metrics.
At a high level, we can break down the GPU operations in a model execution into three broad categories, henceforth referred to as kernel types:
- Computation (COMP) – Compute kernels execute compiled routines for matrix multiplication and similar numeric calculations. They are responsible for all of the number-crunching necessary for model execution.
- Communication (COMM) – Communication kernels are routines which are responsible for exchanging and synchronizing data between different GPU devices in a distributed training job. The NVIDIA Collective Communication Library (NCCL) is a widely used communication library and all its kernels have the prefix “nccl”. Example NCCL kernels include NCCL_AllGather, NCCL_ReduceScatter, NCCL_AllReduce, etc.
- Memory (MEM) – Memory kernels manage the memory allocations/deallocations on the GPU devices and data movement between the memory space on the host and the GPUs. The memory kernels include Memcpy_H2D, Memcpy_D2H, Memcpy_D2D, Memset, etc. Here, H represents the Host and D represents the GPU Device. Thus, H2D, D2H, D2D stands for Host to Device, Device to Host and Device to Device respectively.
Because a modern GPU device like the NVIDIA A100 GPU is a massively parallel device which is capable of running multiple kernels simultaneously, it is possible to overlap the computation, communication, and memory kernels to reduce the model execution time. One common technique to achieve the overlap is to utilize multiple CUDA streams. A CUDA stream is a sequence of operations that execute on a GPU device in the order in which they are issued by the host code. Different CUDA streams can be interleaved and even run concurrently, thus achieving the effect of kernel overlap.
To help understand the above concepts, Figure 1 provides a timeline of the GPU kernels in a sample distributed training job on 8 GPUs for one iteration. In the figure below, each rank represents one GPU and the kernels on each GPU run on 6 CUDA streams. In the right column of the figure, you can see names of the GPU kernels used. In the middle of the figure, you see the overlap between compute and communicate kernels. This figure is created using the plot_timeline example notebook available in HTA.
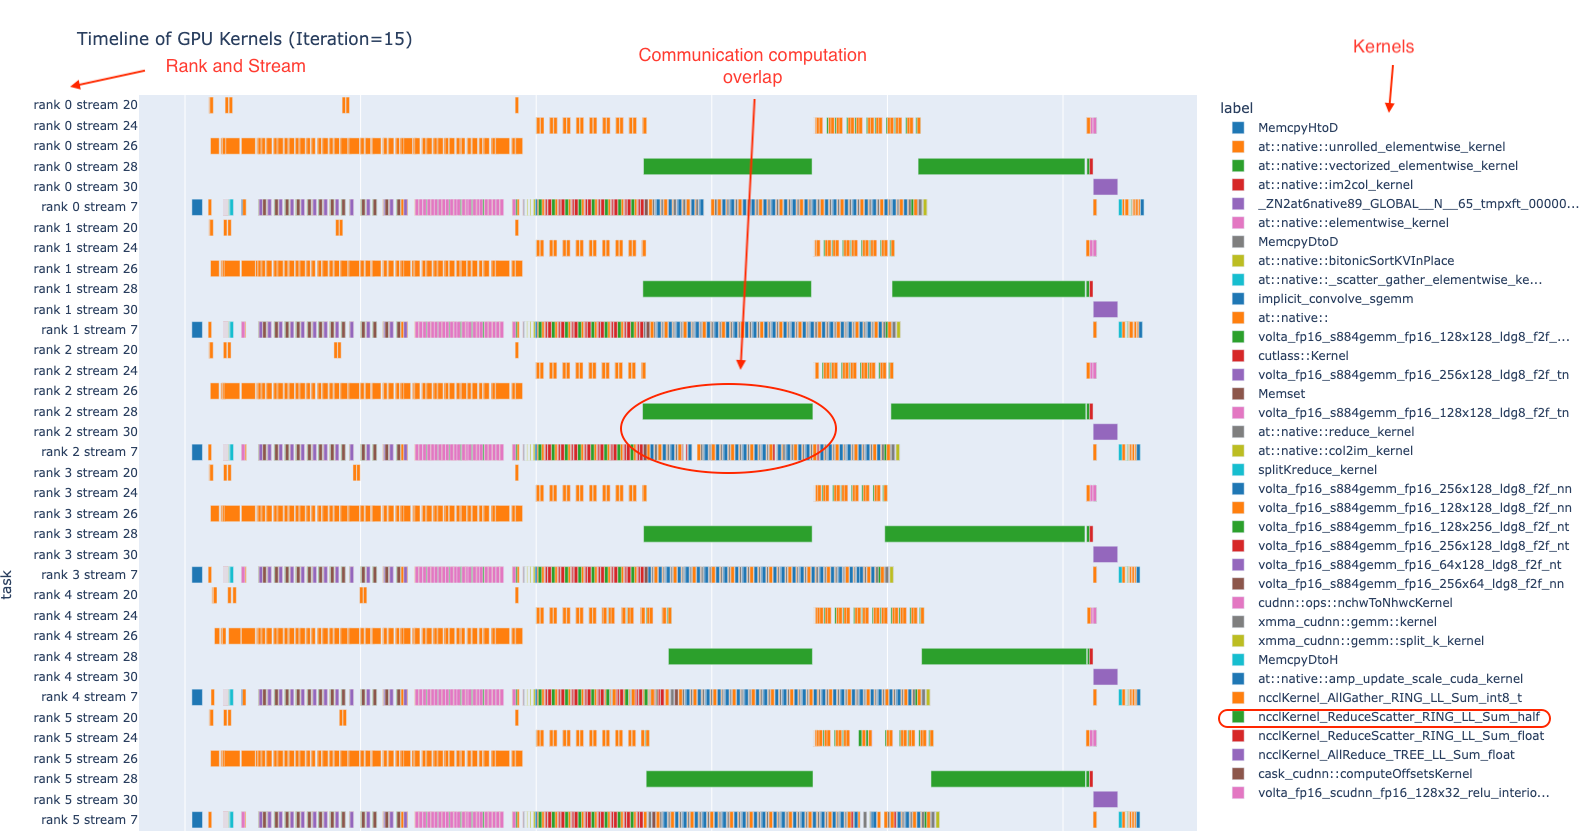
Figure 1. An example of the execution timeline of GPU Kernels across multiple ranks
The performance of multiple GPU training jobs is affected by multiple factors. Among these factors, how does a model execution create and orchestrate the GPU kernels plays a critical role. HTA provides insights on how the model execution interacts with the GPU devices and highlights the opportunities for performance improvement.
With the features we built in HTA, we aim to provide users insights into “what is happening under the hood in a distributed GPU training?” We briefly describe these features in the next few paragraphs.
Features in Holistic Trace Analysis
For most users, understanding the performance of GPU training jobs is nontrivial. Thus, we built this library to simplify the task of trace analysis and provide the user useful insights by examining the model execution traces. As the first step, we developed features which are important and generic enough so that most users can benefit from this library.
Temporal Breakdown: We begin by asking whether the GPU is spending time on computation, communication, memory events, or is it idle? To answer this question, the temporal breakdown feature presents a breakdown in terms of these categories. To achieve high training efficiency the code should maximize time used by computation kernels and minimize idle time and non-compute time (time used by communication or memory kernels). This is accomplished by implementing concurrent execution of computation kernels with communication or memory kernels. Note that, during concurrent execution of computation kernels with communication/memory kernels the time spent by communication/memory kernels is accounted for under compute time.
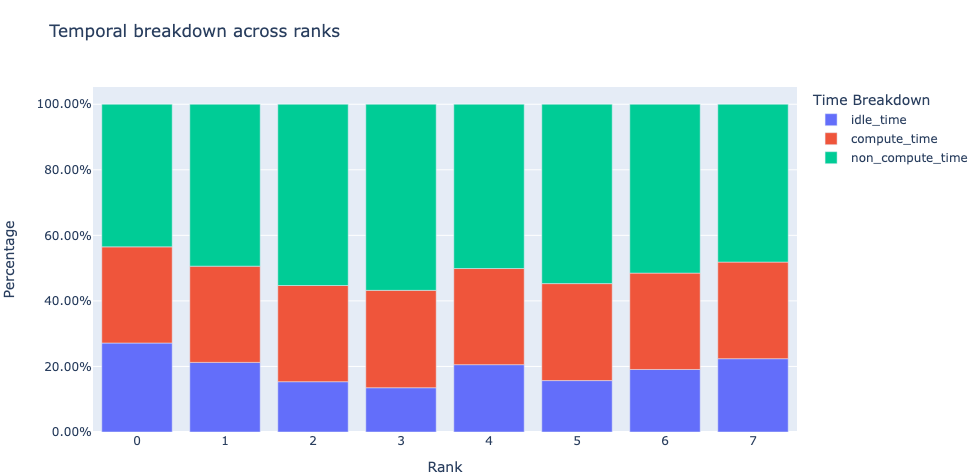
Figure 2: Temporal Breakdown across 8 GPUs
Kernel Breakdown: It is natural to ask which kernels are taking the most amount of time. The next feature breaks down the time spent within each kernel type (COMM, COMP, MEM) and sorts them by duration. We present this information for each kernel type and for each rank as a pie chart. See figure 3 below.
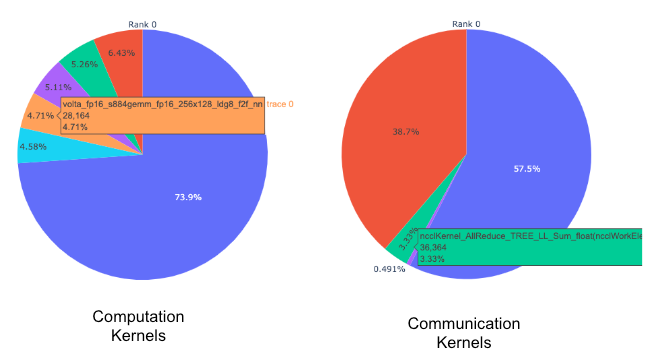
Figure 3: Pie chart of top computation and communication kernels
Kernel Duration Distribution: Subsequently, one can also ask – for any given kernel, what is the distribution of the time spent across the ranks? To answer this, HTA generates bar graphs for the average duration of a given kernel across all ranks. Additionally, the error bars in the bar graphs show the minimum and maximum amount of time taken by a given kernel on a given rank. Figure 4 below shows a discrepancy between average duration on rank 0 as compared to other ranks. This anomalous behavior on rank 0 guides the user on where to look for possible bugs.
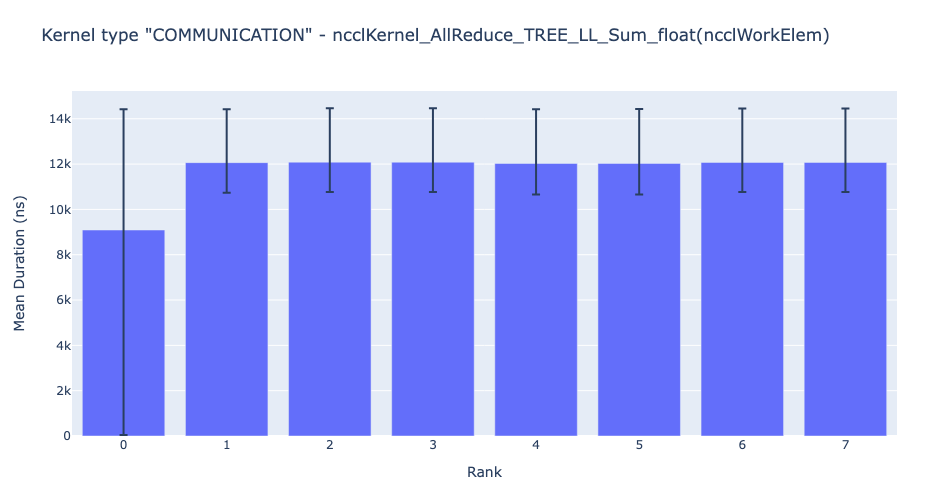
Figure 4: Average duration of NCCL AllReduce Kernel across 8 ranks
Communication Computation Overlap: In distributed training, a significant amount of time is spent in communication and synchronization events among multiple GPU devices. To achieve high GPU efficiency (i.e. TFLOPS/GPU) it is vital to keep the GPU doing actual computation work. In other words, a GPU should not be blocked because of waiting for data from other GPUs. One way to measure the extent to which computation is blocked by data dependencies is to calculate the computation-communication overlap. Higher GPU efficiency is observed if communication events overlap computation events. Lack of communication and computation overlap will lead to the GPU being idle, thus the efficiency would be low. Thus, the communication computation overlap feature calculates the percentage of time communication and computation overlap in a job for each rank and generates a bar graph representation. See figure below. More precisely, we measure the following ratio
(time spent in computation while communicating) / (time spent in communication)
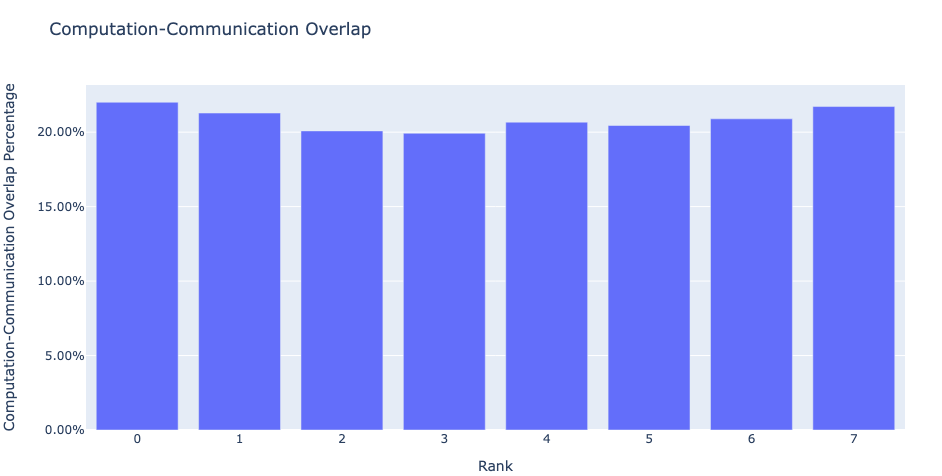
Figure 5: Communication computation overlap
Augmented Counters (Queue length, Memory bandwidth): To aid in debugging, HTA calculates the memory bandwidth statistics for D2H, H2D and D2D memory copy (memcpy) and memory set (memset) events. Additionally, HTA also computes the number of outstanding CUDA operations on each CUDA stream. We refer to this as queue length. When the queue length on a stream is 1024 or larger new events cannot be scheduled on that stream and the CPU will stall until the GPU events have processed. Additionally, HTA generates a new trace file containing tracks with the memory bandwidth and queue length time series. See Figure 6 below.
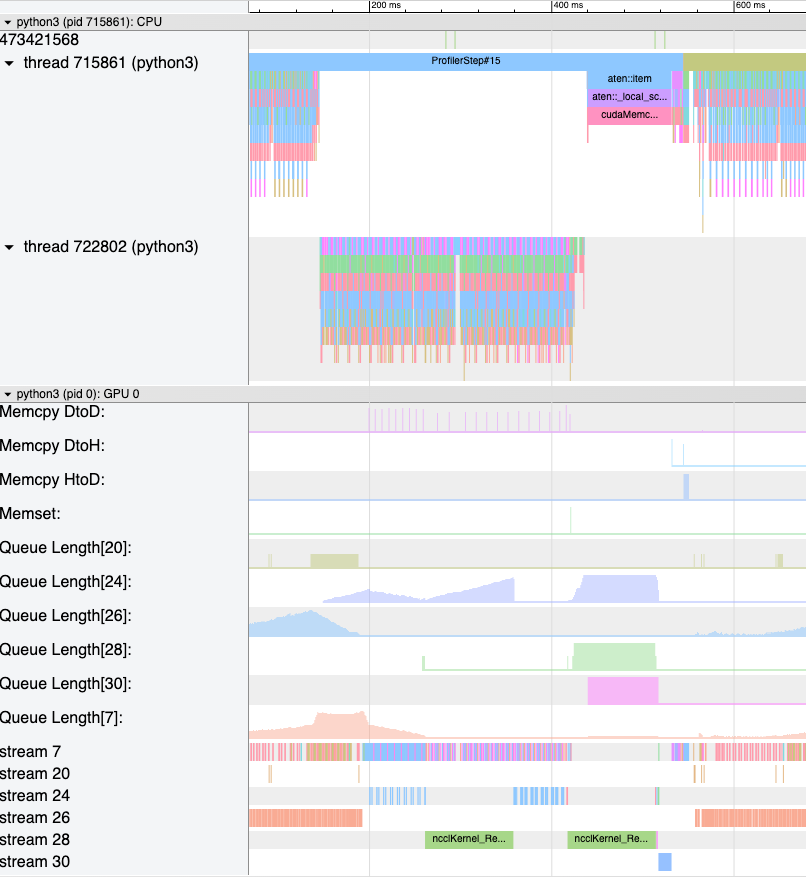
Figure 6: Memory Bandwidth and Queue Length
These primary features give us a peek into the system performance and help answer “what is happening in the system?”. As HTA evolves, we hope to address “why is X happening?” and also suggest possible solutions to overcome the bottlenecks.
Installation and Usage
Installation
For installing the HTA please refer to the README. In brief, the user is required to clone the repo and install the necessary Python packages via pip.
Usage
This version of Holistic Trace Analysis is currently in beta and we recommend using HTA in a Jupyter notebook. A demo notebook is provided for your convenience. To get started, import the hta package in a Jupyter notebook, create a TraceAnalysis object and off we go in exactly two lines of code.
from hta.trace_analysis import TraceAnalysis
analyzer = TraceAnalysis(trace_dir = “/trace/folder/path”)
Requirements
- All trace files for a training or inference job must be stored in a unique folder.
- Trace files are in json or gzipped json format.
FAQ
Q. How can I install HTA?
Please see the README in the root directory of the repository.
Q. Is there any documentation on the features and API in HTA?
The documentation and detailed API is available here.
Q. Can you implement feature X?
Depending on how widely the feature is needed and the level of effort required to implement it we would consider developing the feature. Please open a Github Issue and tag it with the feature-request label.
Q. Can I modify the code?
Please do and send a PR along the way, if you think it would be useful for others.
Q. How can I collect traces in PyTorch?
Please refer to this tutorial here.
Q. Can HTA be used at production scale?
Yes, please see a use case study here.