1. Meta’s AI Performance Profiling (MAIProf)
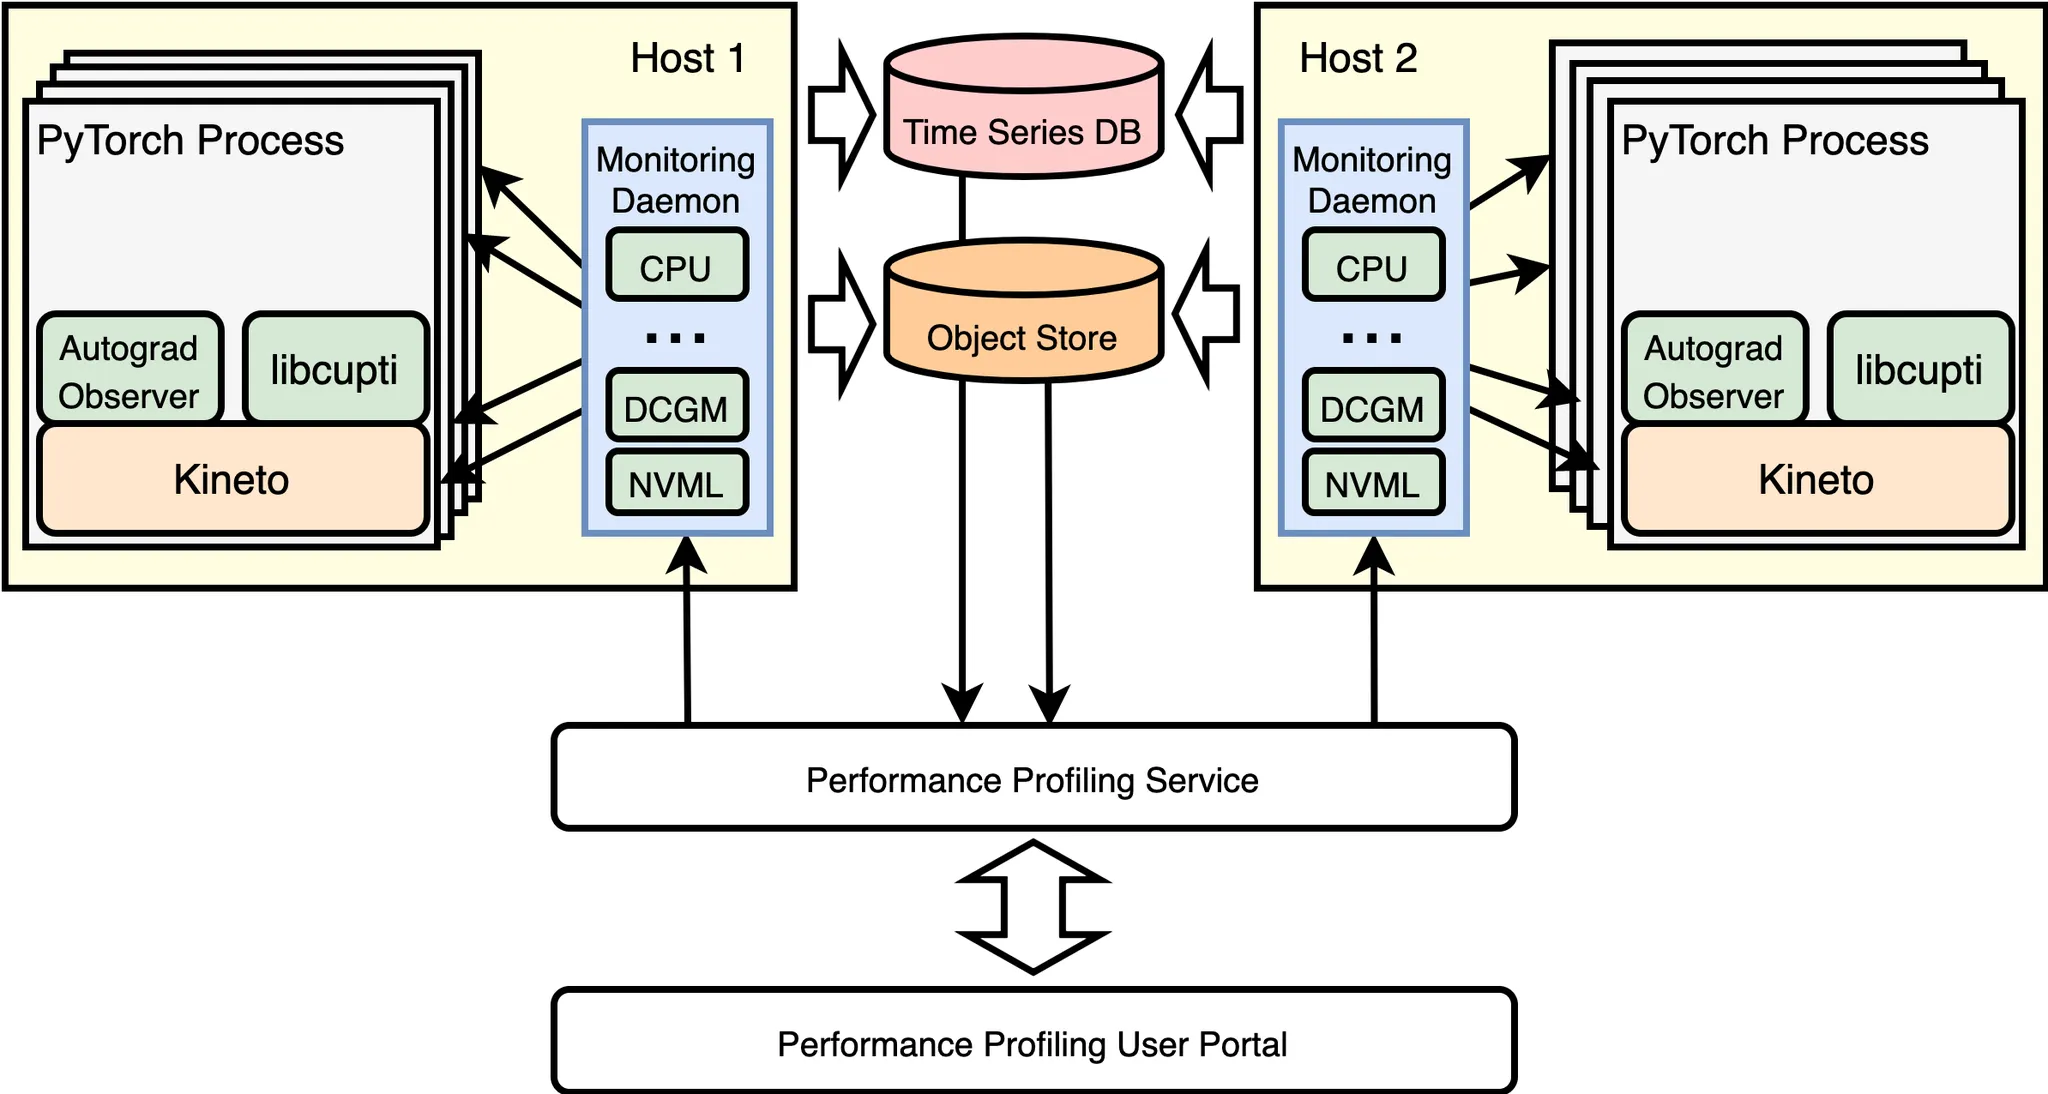
Figure 1: A simplified illustration of the Meta’s AI performance profiling (MAIProf) infrastructure.
Figure 1 gives a simplified illustration of the AI performance profiling infrastructure at Meta. ML research and performance engineers submit through the User Portal a profiling request for a training job to the Profiling Service, which subsequently broadcasts the request to all the GPU hosts running the training job. When the Monitoring Daemon on a GPU host receives the profiling request, it will notify the Kineto GPU tracer (built on top of NVIDIA’s libcupti) inside the PyTorch program corresponding to the training job. As a result, Kineto traces will be collected and uploaded to the Object Store asynchronously (in more details: there is one Kineto trace collected for each individual GPU, each is treated and stored as a blob; an example will be given in Section 2). Meanwhile, MAIProf also collects a variety of aggregated performance metrics: the Monitoring Daemon on every GPU host continuously reads performance counters from NVIDIA’s DCGM/NVML and logs them to a Time Series DB.
Once both trace and metrics collections are completed, the Profiling Service will automatically download traces from the Object Store for trace analysis and performance metrics from the Time Series DB for metric analysis. Finally, an overall profiling report with detailed and insightful analysis is delivered to the user.
To serve production uses, we deliberately made the following design choices for MAIProf:
- No source-code change required in the PyTorch models: profiling is triggered by sampling the execution of an unmodified model for a user-specified amount of time.
- Provide a holistic view of performance: MAIProf performs system-wide analysis that cover both CPU and GPU. Under the hood, it invokes various CPU tools (e.g., Python tracer, Autograd Observer) and GPU tools (e.g., Kineto, DCGM) and correlates their results.
- Provide multiple tools that target a wide range of AI partitioners: At Meta, there are engineers with different backgrounds who may need to tune their AI workload performance. Some of them are AI experts while others are general software engineers. Therefore, MAIProf provides a variety of tools for different levels of performance debugging, from high-level automatic trace comprehension to low-level trace analysis.
- Support distributed GPU profiling: MAIProf can collect profiling data from multiple hosts, each with multiple GPUs. It then shows a combined view/analysis of the entire system.
- Highly scalable: MAIProf is built as a service on top of existing infrastructures in Meta data centers such as a scalable storage system called Manifold. Its profiling capability can be easily scaled by adding more machines in the service pool with the increase of workloads.
2. Case Study: Optimizing a Protection PyTorch Model
To be concrete, we use a case study on a protection PyTorch model used in production. First, we discuss our steps for identifying the performance bottlenecks in the model with MAIProf. Then we describe the corresponding optimizations applied and their impacts.
2.1 Performance Bottlenecks
Step 1:
Inspect the CPU and GPU utilization on the same timeline, as shown in Figure 2.
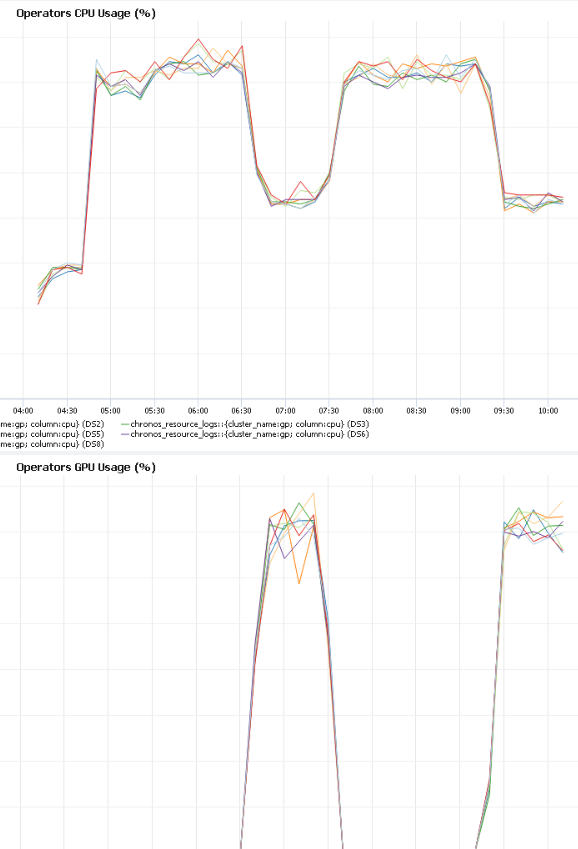
Figure 2: CPU usage over time (the top) vs. GPU usage over time (the bottom).
The first performance anomaly we noticed in Figure 2 is the pattern: “GPU-idle, GPU-active, GPU-idle, GPU-active …” throughout the training. Overall, the GPU is idle for more than half of the training time (this is bad for performance because the GPU is a higher-performance device and so we want it to be utilized as much as possible).
Step 2:
Collect a Python function call trace on the CPU with MAIProf while the GPU is idle, which is shown in Figure 3.
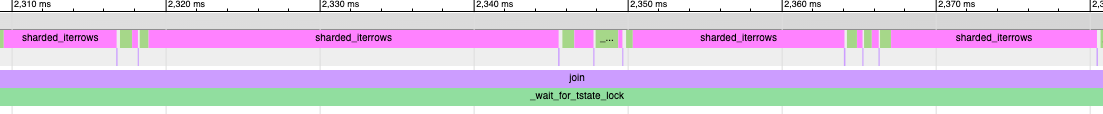
Figure 3: A Python call trace.
The Python trace shows that most of the CPU time is spent inside a Python function sharded_iterrows(). From the source code of the model, we learned that this function processes a big feature table in parallel. The number of worker threads used is controlled by a configurable parameter (num_worker_threads). Also, after investigating how the feature table is generated, we understood the performance anomaly: the training dataset is too large to fit in the CPU memory all at once; it needs to be broken into multiple sub-datasets, each has sufficient data for running 10 epochs. Consequently, a new sub-dataset needs to be read from the disk to memory every 10 epochs, during which the GPU is totally idle.
Step 3:
Collect GPU performance metrics, which is shown in Figure 4.
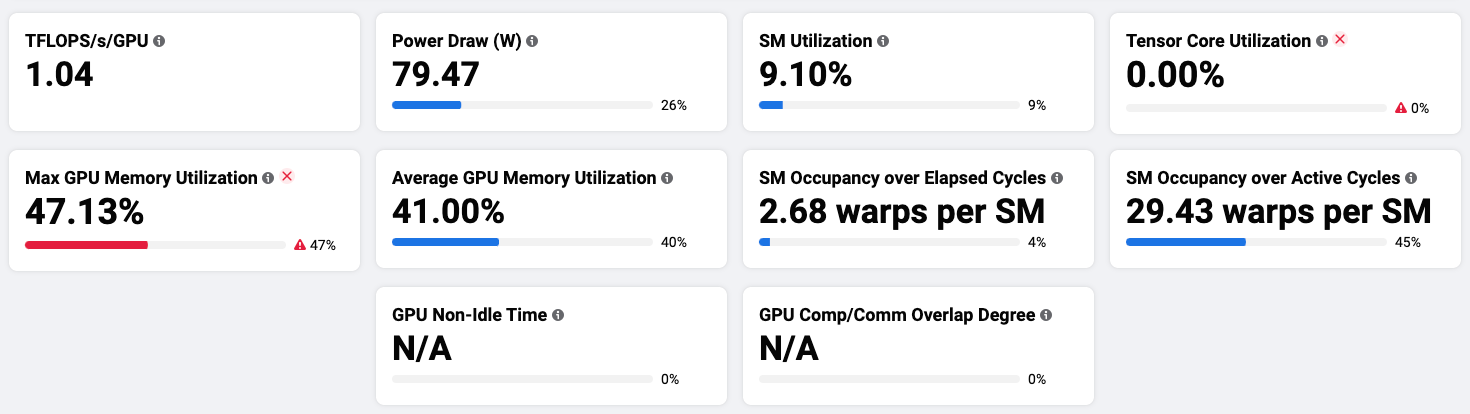
Figure 4: GPU performance metrics in MAIProf.
We made the following observations from Figure 4:
- The streaming multiprocessor (SM) runs the model’s CUDA kernels. Its utilization [1] is 9.1%, indicating that the parallel compute units on the GPU are not well utilized.
- Tensor Core utilization is 0, meaning that Tensor Core (the mixed-precision compute unit on GPU) [2] is not used at all.
- Max GPU memory utilization is 47.13%, indicating that half of the GPU memory is left unused.
Step 4:
Collect a GPU trace (aka Kineto trace) of the training loop as shown in Figure 5.
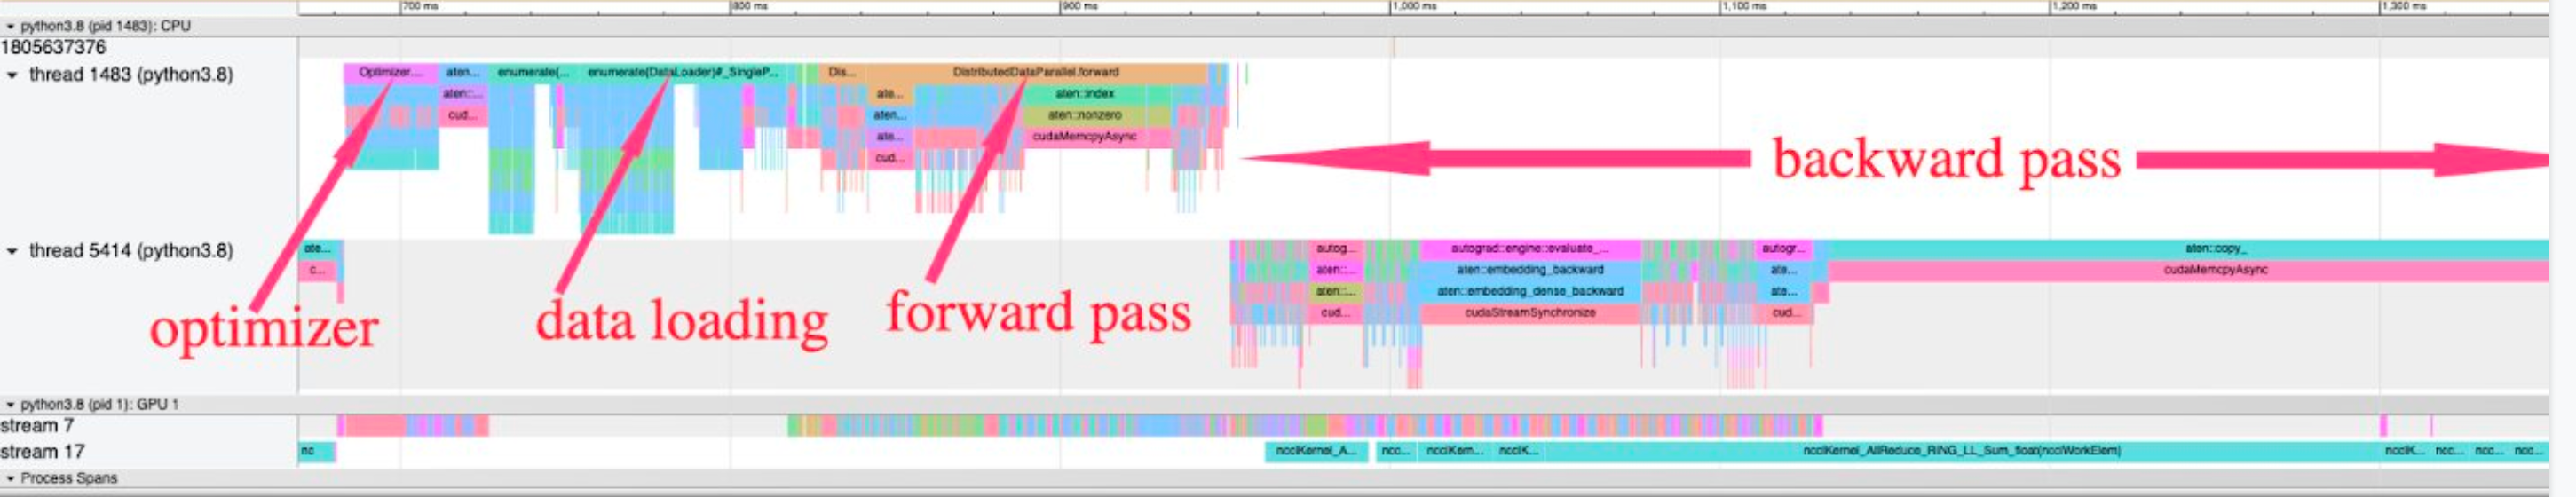
Figure 5: A GPU trace (aka Kineto trace) of the training loop.
Since commonly used PyTorch functions are already annotated, their names are automatically shown on the trace. With them, we can roughly divide the trace into the four phases in a training iteration: (1) data loading, (2) forward pass, (3) backward pass, (4) gradient optimization (note: In Figure 5, the “optimizer” phase is from the previous batch while the other three phases are from the current batch).
2.2 Optimizations
We performed four simple optimizations that target the bottlenecks identified above, each requiring only a change in a config parameter or at most a few source lines. They are listed in Figure 6.
| Optimization | Amount of changes | Bottlenecks addressed |
|---|---|---|
Tune num_worker_threads by trying a few possible values within the number of CPU cores on each host. | 1 source line | GPU totally idle time |
| Double the batch sizes | 2 config parameters | GPU memory under-utilization |
| Use automatic mixed precision in PyTorch | 13 source lines | Zero Tensor Core utilization |
| Use mulitensor optimizer in PyTorch | 1 source line | Many small GPU kernels in the optimizer |
Figure 6: Four simple optimizations applied.
3. Concluding Remarks
Performance tuning for PyTorch in production environments is increasingly important. A capable performance-debugging tool is a key to this process. We demonstrate with a case study on a production model that MAIProf is a powerful infrastructure for identifying optimization opportunities.
At Meta, MAIProf has been used by 100s of engineers, from performance novices to experts, to identify many more types of bottlenecks. These include slow data loading, small and/or slow GPU kernels, distributed training issues such as load imbalance and excessive communication. MAIProf covers major classes of models, including recommendation, vision, and natural language processing. In summary, it is now an indispensable tool for tuning the performance of production PyTorch workloads.