Along with PyTorch 1.8.1 release, we are excited to announce PyTorch Profiler – the new and improved performance debugging profiler for PyTorch. Developed as part of a collaboration between Microsoft and Facebook, the PyTorch Profiler is an open-source tool that enables accurate and efficient performance analysis and troubleshooting for large-scale deep learning models.
Analyzing and improving large-scale deep learning model performance is an ongoing challenge that grows in importance as the model sizes increase. For a long time, PyTorch users had a hard time solving this challenge due to the lack of available tools. There were standard performance debugging tools that provide GPU hardware level information but missed PyTorch-specific context of operations. In order to recover missed information, users needed to combine multiple tools together or manually add minimum correlation information to make sense of the data. There was also the autograd profiler (torch.autograd.profiler) which can capture information about PyTorch operations but does not capture detailed GPU hardware-level information and cannot provide support for visualization.
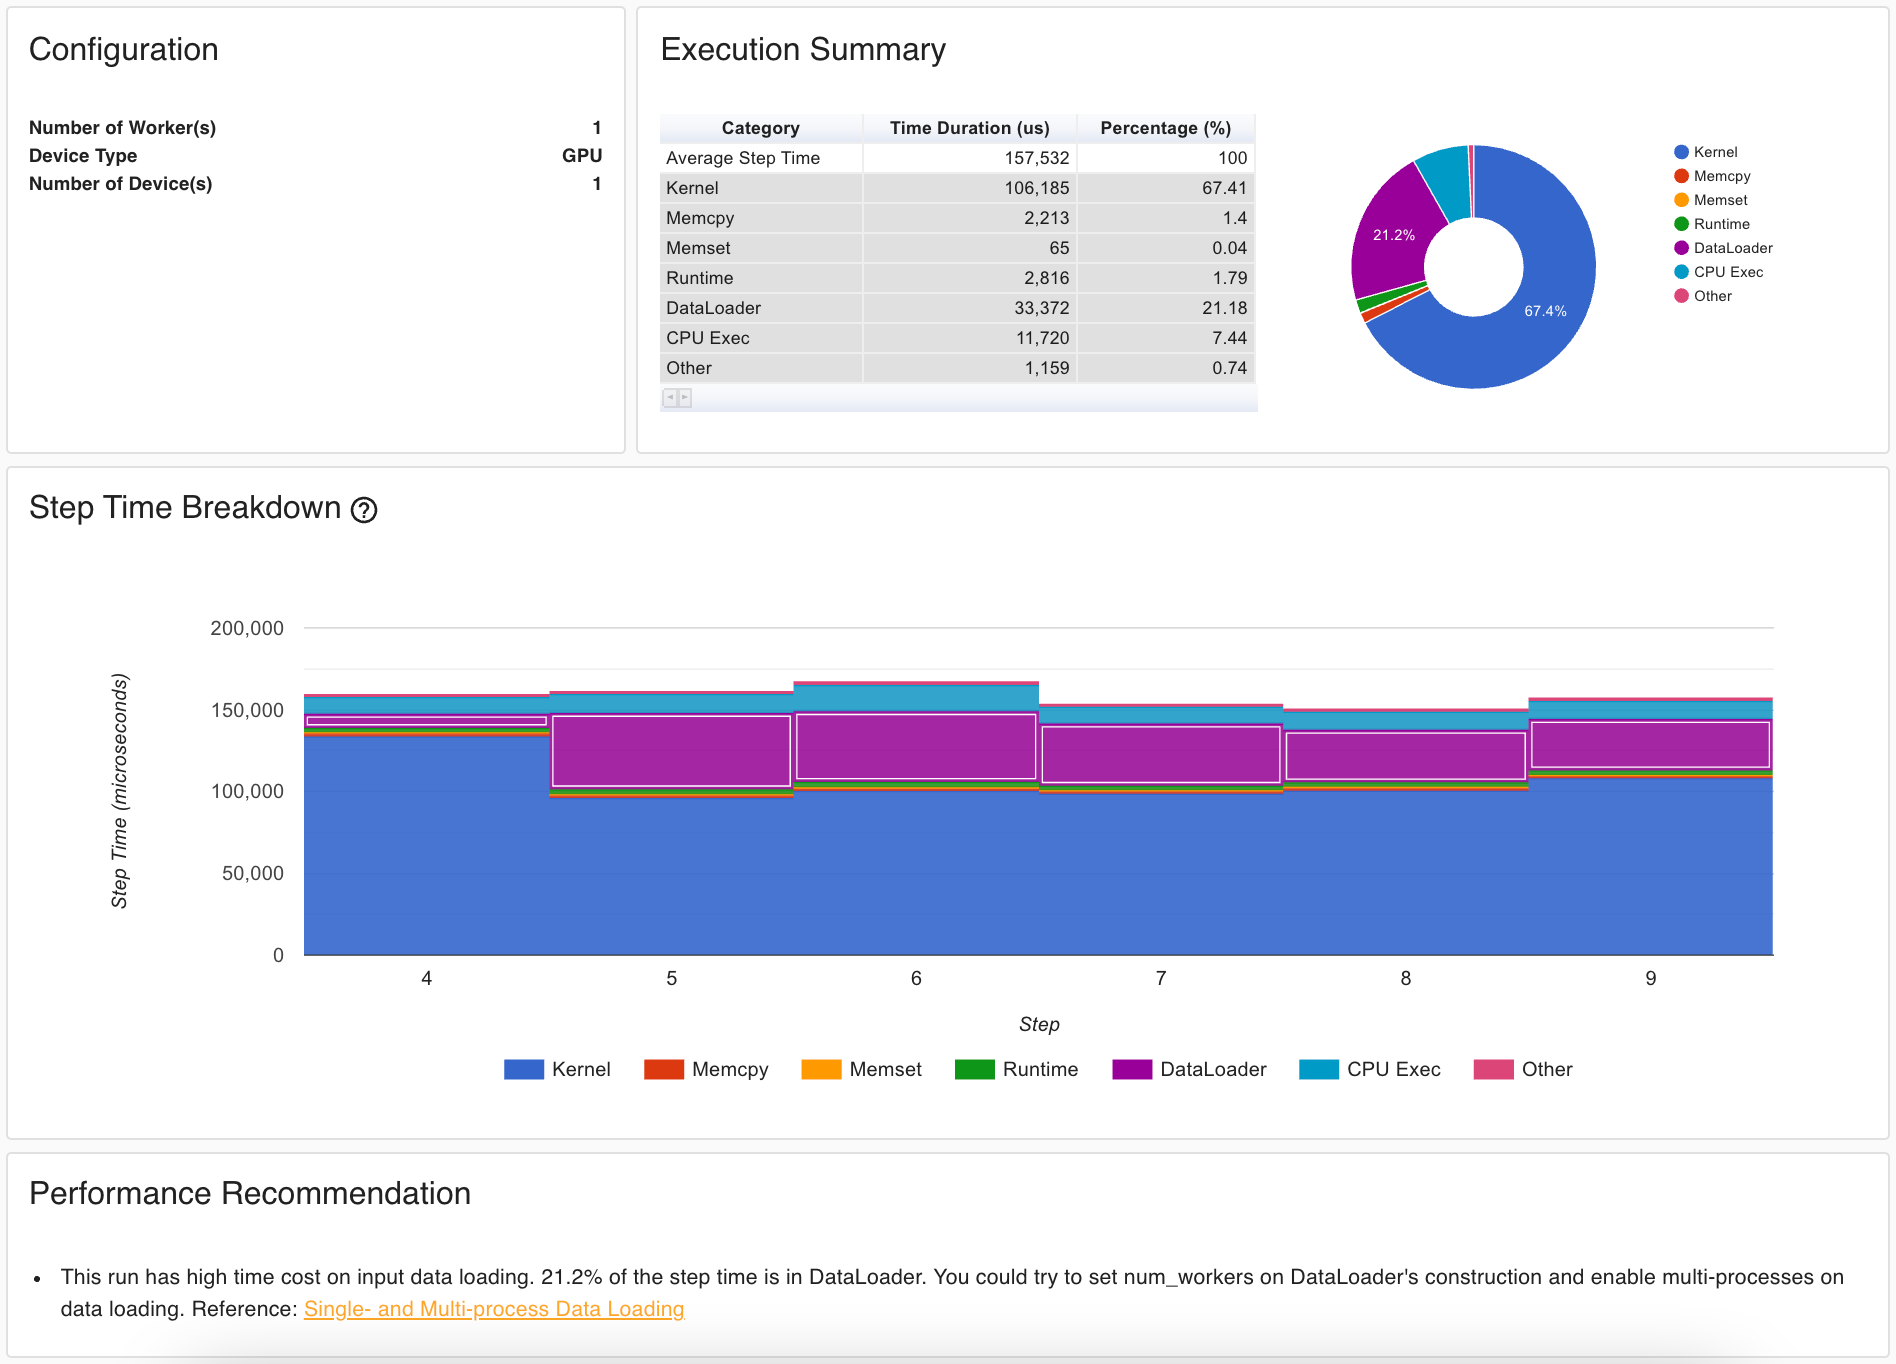
The new PyTorch Profiler (torch.profiler) is a tool that brings both types of information together and then builds experience that realizes the full potential of that information. This new profiler collects both GPU hardware and PyTorch related information, correlates them, performs automatic detection of bottlenecks in the model, and generates recommendations on how to resolve these bottlenecks. All of this information from the profiler is visualized for the user in TensorBoard. The new Profiler API is natively supported in PyTorch and delivers the simplest experience available to date where users can profile their models without installing any additional packages and see results immediately in TensorBoard with the new PyTorch Profiler plugin. Below is the screenshot of PyTorch Profiler – automatic bottleneck detection.
Getting started
PyTorch Profiler is the next version of the PyTorch autograd profiler. It has a new module namespace torch.profiler but maintains compatibility with autograd profiler APIs. The Profiler uses a new GPU profiling engine, built using Nvidia CUPTI APIs, and is able to capture GPU kernel events with high fidelity. To profile your model training loop, wrap the code in the profiler context manager as shown below.
 with torch.profiler.profile(
    schedule=torch.profiler.schedule(
        wait=2,
        warmup=2,
        active=6,
        repeat=1),
    on_trace_ready=tensorboard_trace_handler,
    with_stack=True
) as profiler:
    for step, data in enumerate(trainloader, 0):
        print("step:{}".format(step))
        inputs, labels = data[0].to(device=device), data[1].to(device=device)

        outputs = model(inputs)
        loss = criterion(outputs, labels)

        optimizer.zero_grad()
        loss.backward()
        optimizer.step()
        profiler.step()
The schedule parameter allows you to limit the number of training steps included in the profile to reduce the amount of data collected and simplify visual analysis by focusing on what’s important. The tensorboard_trace_handler automatically saves profiling results to disk for analysis in TensorBoard.
To view results of the profiling session in TensorBoard, install PyTorch Profiler TensorBoard Plugin package.
pip install torch_tb_profiler
Visual Studio Code Integration
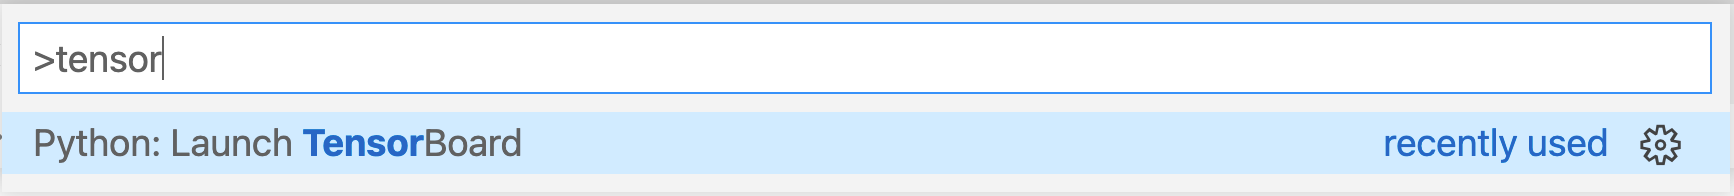
Microsoft Visual Studio Code is one of the most popular code editors for Python developers and data scientists. The Python extension for VS Code recently added the integration of TensorBoard into the code editor, including support for the PyTorch Profiler. Once you have VS Code and the Python extension installed, you can quickly open the TensorBoard Profiler plugin by launching the Command Palette using the keyboard shortcut CTRL + SHIFT + P (CMD + SHIFT + P on a Mac) and typing the “Launch TensorBoard” command.
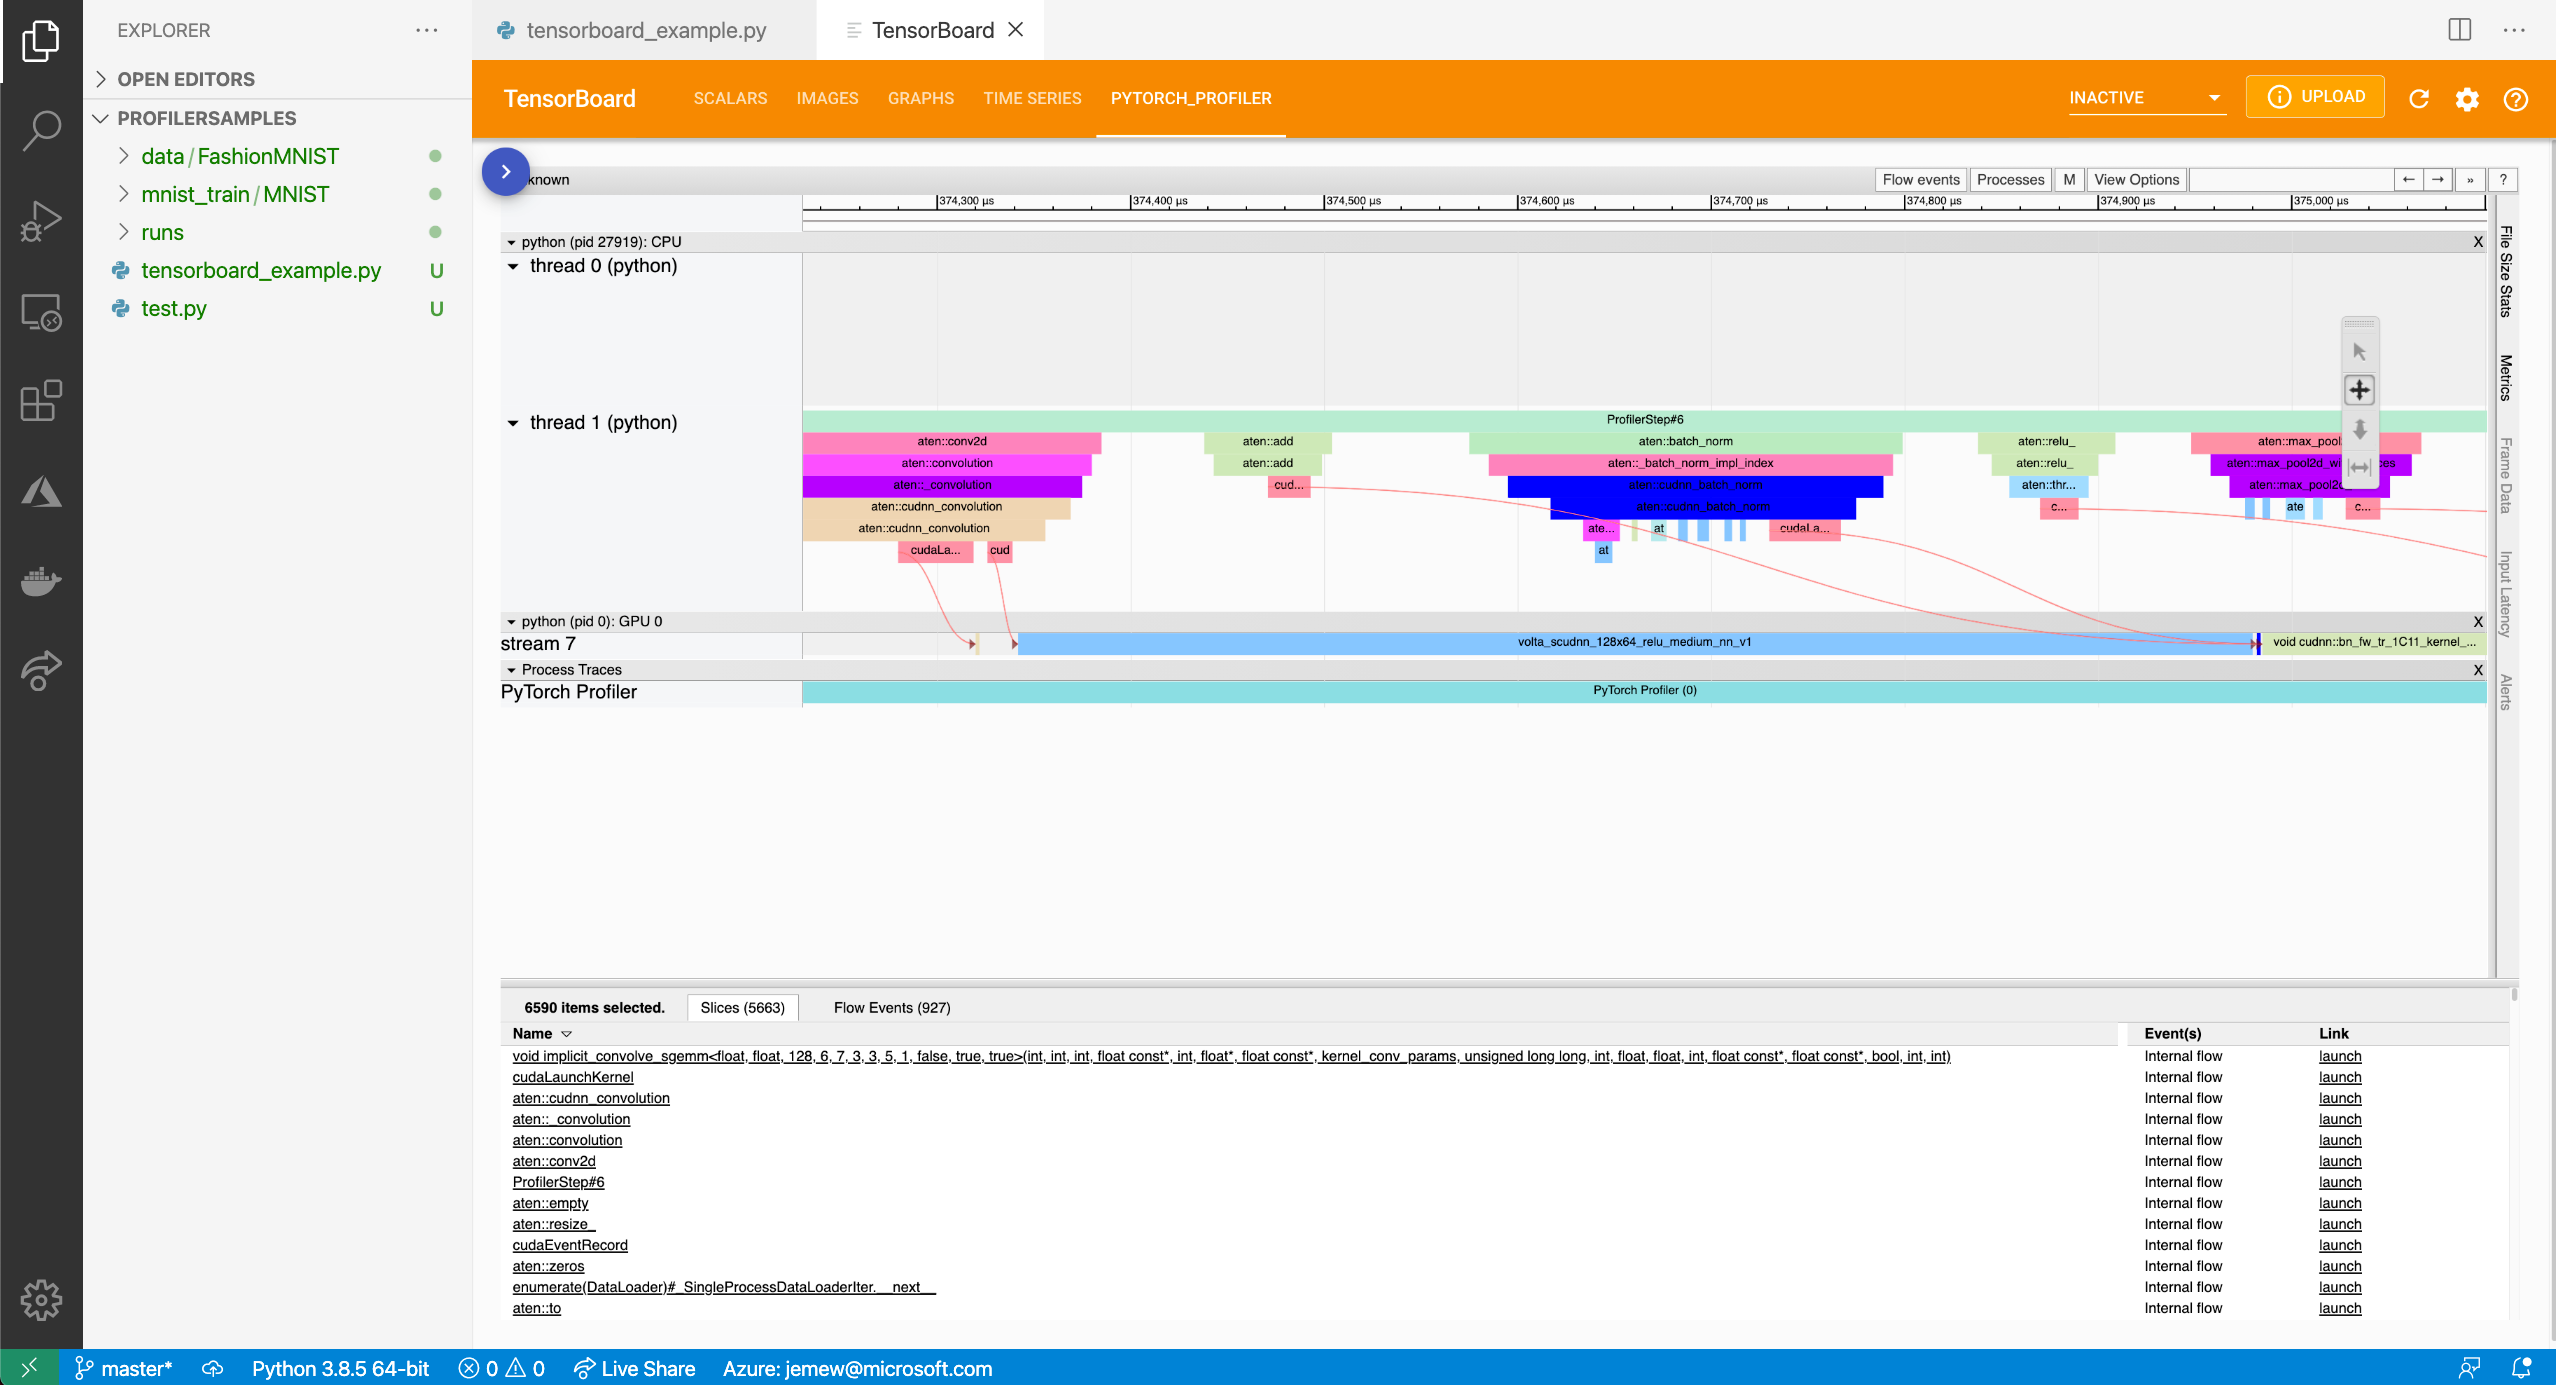
This integration comes with a built-in lifecycle management feature. VS Code will install the TensorBoard package and the PyTorch Profiler plugin package (coming in mid-April) automatically if you don’t have them on your system. VS Code will also launch TensorBoard process for you and automatically look for any TensorBoard log files within your current directory. When you’re done, just close the tab and VS Code will automatically close the process. No more Terminal windows running on your system to provide a backend for the TensorBoard UI! Below is PyTorch Profiler Trace View running in TensorBoard.
Learn more about TensorBoard support in VS Code in this blog.
Feedback
Review PyTorch Profiler documentation, give Profiler a try and let us know about your experience. Provide your feedback on PyTorch Discussion Forum or file issues on PyTorch GitHub.