Frequently Asked Questions
Author: Mark Saroufim
Does torch.compile support training?
torch.compile supports training, using AOTAutograd to capture backwards:
The
.forward()graph andoptimizer.step()is captured by TorchDynamo’s pythonevalframefrontend.For each segment of
.forward()that torchdynamo captures, it uses AOTAutograd to generate a backward graph segment.Each pair of forward and backward graph are (optionally) min-cut partitioned to save the minimal state between forward and backward.
The forward and backward pairs are wrapped in
autograd.functionmodules.Usercode calling
.backward()still triggers eager’s autograd engine, which runs each compiled backward graph as if it were one op, also running any non-compiled eager ops’.backward()functions.
Do you support Distributed code?
torch.compile supports DistributedDataParallel (DDP).
Support for other distributed training libraries is being considered.
The main reason why Distributed code is challenging with dynamo is because AOTAutograd unrolls both the forward and backward pass and provides 2 graphs for backends to optimize. This is a problem for distributed code because we’d like to ideally overlap communication operations with computations. Eager pytorch accomplishes this in different ways for DDP/FSDP- using autograd hooks, module hooks, and modifications/mutations of module states. In a naive application of dynamo, hooks that should run directly after an operation during backwards may be delayed until after the entire compiled region of backwards ops, due to how AOTAutograd compiled functions interact with dispatcher hooks.
The basic strategy for optimizing DDP with Dynamo is outlined in distributed.py where the main idea will be to graph break on DDP bucket boundaries.
When each node in DDP needs to synchronize its weights with the other nodes it organizes its gradients and parameters into buckets which reduces communication times and allows a node to broadcast a fraction of its gradients to other waiting nodes.
Graph breaks in distributed code mean you can expect dynamo and its backends to optimize the compute overhead of a distributed program but not its communication overhead. Graph-breaks may interfere with compilation speedups, if the reduced graph-size robs the compiler of fusion opportunities. However, there are diminishing returns with increasing graph size since most of the current compute optimizations are local fusions. So in practice this approach may be sufficient.
Do I still need to export whole graphs?
For the vast majority of models you probably don’t and you can use
torch.compile() as is but there are a few situations where
full graphs are necessary and you can can ensure a full graph by simply
running torch.compile(..., fullgraph=True). These situations include:
Large scale training runs, such as $250K+ that require pipeline parallelism and other advanced sharding strategies.
Inference optimizers like TensorRT or AITemplate that rely on fusing much more aggressively than training optimizers.
Mobile training or inference.
Future work will include tracing communication operations into graphs, coordinating these operations with compute optimizations, and optimizing the communication operations.
Why is my code crashing?
If your code ran just fine without torch.compile and started to
crash with it is enabled, then the most important first step is figuring
out which part of the stack your failure occurred. To troubleshoot that,
follow the steps below and only try the next step if the previous one
succeeded.
torch.compile(..., backend="eager")which only runs TorchDynamo forward graph capture and then runs the captured graph with PyTorch. If this fails then there’s an issue with TorchDynamo.torch.compile(..., backend="aot_eager")which runs TorchDynamo to capture a forward graph, and then AOTAutograd to trace the backward graph without any additional backend compiler steps. PyTorch eager will then be used to run the forward and backward graphs. If this fails then there’s an issue with AOTAutograd.torch.compile(..., backend="inductor")which runs TorchDynamo to capture a forward graph, and then AOTAutograd to trace the backward graph with the TorchInductor compiler. If this fails then there’s an issue with TorchInductor
Why is compilation slow?
Dynamo Compilation– TorchDynamo has a builtin stats function for collecting and displaying the time spent in each compilation phase. These stats can be accessed by calling
torch._dynamo.utils.compile_times()after executingtorch._dynamo. By default, this returns a string representation of the compile times spent in each TorchDynamo function by name.Inductor Compilation– TorchInductor has a builtin stats and trace function for displaying time spent in each compilation phase, output code, output graph visualization and IR dump.
env TORCH_COMPILE_DEBUG=1 python repro.py. This is a debugging tool designed to make it easier to debug/understand the internals of TorchInductor with an output that will look something like this Each file in that debug trace can be enabled/disabled viatorch._inductor.config.trace.*. The profile and the diagram are both disabled by default since they are expensive to generate. See the example debug directory output for more examples.Excessive Recompilation When TorchDynamo compiles a function (or part of one), it makes certain assumptions about locals and globals in order to allow compiler optimizations, and expresses these assumptions as guards that check particular values at runtime. If any of these guards fail, Dynamo will recompile that function (or part) up to
torch._dynamo.config.cache_size_limittimes. If your program is hitting the cache limit, you will first need to determine which guard is failing and what part of your program is triggering it. The recompilation profiler automates the process of setting TorchDynamo’s cache limit to 1 and running your program under an observation-only ‘compiler’ that records the causes of any guard failures. You should be sure to run your program for at least as long (as many iterations) as you were running when you ran into trouble, and the profiler will accumulate statistics over this duration.
Why are you recompiling in production?
In some cases, you may not want unexpected compiles after a program has warmed up. For example, if you are serving production traffic in a latency critical application. For this, TorchDynamo provides an alternate mode where prior compiled graphs are used, but no new ones are generated:
frozen_toy_example = dynamo.run(toy_example)
frozen_toy_example(torch.randn(10), torch.randn(10))
How are you speeding up my code?
There are 3 major ways to accelerate PyTorch code:
Kernel fusion via vertical fusions which fuse sequential operations to avoid excessive read/writes. For example, fuse 2 subsequent cosines means you can can do 1 read 1 write instead 2 reads 2 writes 2. Horizontal fusion: the simplest example being batching where a single matrix is multiplied with a batch of examples but the more general scenario is a grouped GEMM where a group of matrix multiplications are scheduled together
Out of order execution: A general optimization for compilers, by looking ahead at the exact data dependencies within a graph we can decide on the most opportune time to execute a node and which buffers can be reused
Automatic work placement: Similar of the out of order execution point, but by matching nodes of a graph to resources like physical hardware or memory we can design an appropriate schedule
The above are general principles for accelerating PyTorch code but different backends will each make different tradeoffs on what to optimize. For example Inductor first takes care of fusing whatever it can and only then generates Triton kernels.
Triton in addition offers speedups because of automatic memory coalescing, memory management and scheduling within each Streaming Multiprocessor and has been designed to handle tiled computations.
However, regardless of the backend you use it’s best to use a benchmark and see approach so try out the PyTorch profiler, visually inspect the generated kernels and try to see what’s going on for yourself.
Why am I not seeing speedups?
Graph Breaks
The main reason you won’t see the speedups you’d like to by using dynamo is excessive graph breaks. So what’s a graph break?
Given a program like:
def some_fun(x):
    ...

torch.compile(some_fun)(x)
...
Torchdynamo will attempt to compile all of the torch/tensor operations
within some_fun() into a single FX graph, but it may fail to capture
everything into one graph.
Some graph break reasons are insurmountable to TorchDynamo like calling into a C extension other than PyTorch is invisible to TorchDynamo, and could do arbitrary things without TorchDynamo being able to introduce necessary guards to ensure that the compiled program would be safe to reuse.
To maximize performance, it’s important to have as few graph breaks as possible.
Identifying the cause of a graph break
To identify all graph breaks in a program and the associated reasons for
the breaks, torch._dynamo.explain can be used. This tool runs
TorchDynamo on the supplied function and aggregates the graph breaks
that are encountered. Here is an example usage:
import torch
import torch._dynamo as dynamo
def toy_example(a, b):
    x = a / (torch.abs(a) + 1)
    print("woo")
    if b.sum() < 0:
        b = b * -1
    return x * b
explanation = dynamo.explain(toy_example)(torch.randn(10), torch.randn(10))
print(explanation)
"""
Graph Count: 3
Graph Break Count: 2
Op Count: 5
Break Reasons:
  Break Reason 1:
    Reason: builtin: print [<class 'torch._dynamo.variables.constant.ConstantVariable'>] False
    User Stack:
      <FrameSummary file foo.py, line 5 in toy_example>
  Break Reason 2:
    Reason: generic_jump TensorVariable()
    User Stack:
      <FrameSummary file foo.py, line 6 in torch_dynamo_resume_in_toy_example_at_5>
Ops per Graph:
  ...
Out Guards:
  ...
"""
To throw an error on the first graph break encountered you can
disable python fallbacks by using fullgraph=True, this should be
familiar if you’ve worked with export based compilers.
def toy_example(a, b):
   ...

torch.compile(toy_example, fullgraph=True, backend=<compiler>)(a, b)
Why didn’t my code recompile when I changed it?
If you enabled dynamic shapes by setting
env TORCHDYNAMO_DYNAMIC_SHAPES=1 python model.py then your code
won’t recompile on shape changes. We’ve added support for dynamic shapes
which avoids recompilations in the case when shapes vary by less than a
factor of 2. This is especially useful in scenarios like varying image
sizes in CV or variable sequence length in NLP. In inference scenarios
it’s often not possible to know what a batch size will be beforehand
because you take what you can get from different client apps.
In general, TorchDynamo tries very hard not to recompile things unnecessarily so if for example TorchDynamo finds 3 graphs and your change only modified one graph then only that graph will recompile. So another tip to avoid potentially slow compilation times is to warmup a model by compiling it once after which subsequent compilations will be much faster. Cold start compile times is still a metric we track visibly.
Why am I getting incorrect results?
Accuracy issues can also be minified if you set the environment variable
TORCHDYNAMO_REPRO_LEVEL=4, it operates with a similar git bisect
model and a full repro might be something like
TORCHDYNAMO_REPRO_AFTER="aot" TORCHDYNAMO_REPRO_LEVEL=4 the reason
we need this is downstream compilers will codegen code whether it’s
Triton code or the C++ backend, the numerics from those downstream
compilers can be different in subtle ways yet have dramatic impact on
your training stability. So the accuracy debugger is very useful for us
to detect bugs in our codegen or with a backend compiler.
If you’d like to ensure that random number generation is the same across both torch
and triton then you can enable torch._inductor.config.fallback_random = True
Why am I getting OOMs?
Dynamo is still an alpha product so there’s a few sources of OOMs and if
you’re seeing an OOM try disabling the following configurations in this
order and then open an issue on GitHub so we can solve the root problem
1. If you’re using dynamic shapes try disabling them, we’ve disabled
them by default: env TORCHDYNAMO_DYNAMIC_SHAPES=0 python model.py 2.
CUDA graphs with Triton are enabled by default in inductor but removing
them may alleviate some OOM issues: torch._inductor.config.triton.cudagraphs = False.
Does torch.func work with torch.compile (for grad and vmap transforms)?
Applying a torch.func transform to a function that uses torch.compile
does work:
import torch

@torch.compile
def f(x):
    return torch.sin(x)

def g(x):
    return torch.grad(f)(x)

x = torch.randn(2, 3)
g(x)
Compiling torch.func.grad with torch.compile
import torch

def wrapper_fn(x):
    return torch.func.grad(lambda x: x.sin().sum())(x)

x = torch.randn(3, 3, 3)
grad_x = torch.compile(wrapper_fn)(x)
Compiling torch.vmap with torch.compile
import torch

def my_fn(x):
    return torch.vmap(lambda x: x.sum(1))(x)

x = torch.randn(3, 3, 3)
output = torch.compile(my_fn)(x)
Compiling functions besides the ones which are supported (escape hatch)
For other transforms, as a workaround, use torch._dynamo.allow_in_graph
allow_in_graph is an escape hatch. If your code does not work with
torch.compile, which introspects Python bytecode, but you believe it
will work via a symbolic tracing approach (like jax.jit), then use
allow_in_graph.
By using allow_in_graph to annotate a function, you must make sure
your code meets the following requirements:
All outputs in your function only depend on the inputs and do not depend on any captured Tensors.
Your function is functional. That is, it does not mutate any state. This may be relaxed; we actually support functions that appear to be functional from the outside: they may have in-place PyTorch operations, but may not mutate global state or inputs to the function.
Your function does not raise data-dependent errors.
import torch

@torch.compile
def f(x):
    return torch._dynamo.allow_in_graph(torch.vmap(torch.sum))(x)

x = torch.randn(2, 3)
f(x)
A common pitfall is using allow_in_graph to annotate a function that
invokes an nn.Module. This is because the outputs now depend on the
parameters of the nn.Module. To get this to work, use
torch.func.functional_call to extract the module state.
Does NumPy work with torch.compile?
Starting in 2.1, torch.compile understands native NumPy programs that
work on NumPy arrays, and mixed PyTorch-NumPy programs that convert from PyTorch
to NumPy and back via x.numpy(), torch.from_numpy, and related functions.
Which NumPy features does torch.compile support?
NumPy within torch.compile follows NumPy 2.0 pre-release.
Generally, torch.compile is able to trace through most NumPy constructions,
and when it cannot, it falls back to eager and lets NumPy execute that piece of
code. Even then, there are a few features where torch.compile semantics
slightly deviate from those of NumPy:
NumPy scalars: We model them as 0-D arrays. That is,
np.float32(3)returns a 0-D array undertorch.compile. To avoid a graph break, it is best to use this 0-D array. If this breaks your code, you can workaround this by casting the NumPy scalar to the relevant Python scalar typebool/int/float.Negative strides:
np.flipand slicing with a negative step return a copy.Type promotion: NumPy’s type promotion will change in NumPy 2.0. The new rules are described in NEP 50.
torch.compileimplements NEP 50 rather than the current soon-to-be deprecated rules.{tril,triu}_indices_from/{tril,triu}_indicesreturn arrays rather than a tuple of arrays.
There are other features for which we do not support tracing and we gracefully fallback to NumPy for their execution:
Non-numeric dtypes like datetimes, strings, chars, void, structured dtypes and recarrays.
Long dtypes
np.float128/np.complex256and some unsigned dtypesnp.uint16/np.uint32/np.uint64.ndarraysubclasses.Masked arrays.
Esoteric ufunc machinery like
axes=[(n,k),(k,m)->(n,m)]and ufunc methods (e.g.,np.add.reduce).Sorting / ordering
complex64/complex128arrays.NumPy
np.poly1dandnp.polynomial.Positional
out1, out2args in functions with 2 or more returns (out=tupledoes work).__array_function__,__array_interface__and__array_wrap__.ndarray.ctypesattribute.
Can I compile NumPy code using torch.compile?
Of course you do! torch.compile understands NumPy code natively, and treats it
as if it were PyTorch code. To do so, simply wrap NumPy code with the torch.compile
decorator.
import torch
import numpy as np

@torch.compile
def numpy_fn(X: np.ndarray, Y: np.ndarray) -> np.ndarray:
    return np.sum(X[:, :, None] * Y[:, None, :], axis=(-2, -1))

X = np.random.randn(1024, 64)
Y = np.random.randn(1024, 64)
Z = numpy_fn(X, Y)
assert isinstance(Z, np.ndarray)
Executing this example with the environment variable TORCH_LOGS=output_code, we can see
that torch.compile was able to fuse the multiplication and the sum into one C++ kernel.
It was also able to execute them in parallel using OpenMP (native NumPy is single-threaded).
This can easily make your NumPy code n times faster, where n is the number of cores
in your processor!
Tracing NumPy code this way also supports graph breaks within the compiled code.
Can I execute NumPy code on CUDA and compute gradients via torch.compile?
Yes you can! To do so, you may simply execute your code within a torch.device("cuda")
context. Consider the example
import torch
import numpy as np

@torch.compile
def numpy_fn(X: np.ndarray, Y: np.ndarray) -> np.ndarray:
    return np.sum(X[:, :, None] * Y[:, None, :], axis=(-2, -1))

X = np.random.randn(1024, 64)
Y = np.random.randn(1024, 64)
with torch.device("cuda"):
    Z = numpy_fn(X, Y)
assert isinstance(Z, np.ndarray)
In this example, numpy_fn will be executed in CUDA. For this to be
possible, torch.compile automatically moves X and Y from CPU
to CUDA, and then it moves the result Z from CUDA to CPU. If we are
executing this function several times in the same program run, we may want
to avoid all these rather expensive memory copies. To do so, we just need
to tweak our numpy_fn so that it accepts cuda Tensors and returns tensors.
We can do so by using torch.compiler.wrap_numpy:
@torch.compile(fullgraph=True)
@torch.compiler.wrap_numpy
def numpy_fn(X, Y):
    return np.sum(X[:, :, None] * Y[:, None, :], axis=(-2, -1))

X = torch.randn(1024, 64, device="cuda")
Y = torch.randn(1024, 64, device="cuda")
Z = numpy_fn(X, Y)
assert isinstance(Z, torch.Tensor)
assert Z.device.type == "cuda"
Here, we explicitly create the tensors in CUDA memory, and pass them to the
function, which performs all the computations on the CUDA device.
wrap_numpy is in charge of marking any torch.Tensor input as an input
with np.ndarray semantics at a torch.compile level. Marking tensors
inside the compiler is a very cheap operation, so no data copy or data movement
happens during runtime.
Using this decorator, we can also differentiate through NumPy code!
@torch.compile(fullgraph=True)
@torch.compiler.wrap_numpy
def numpy_fn(X, Y):
    return np.mean(np.sum(X[:, :, None] * Y[:, None, :], axis=(-2, -1)))

X = torch.randn(1024, 64, device="cuda", requires_grad=True)
Y = torch.randn(1024, 64, device="cuda")
Z = numpy_fn(X, Y)
assert isinstance(Z, torch.Tensor)
Z.backward()
# X.grad now holds the gradient of the computation
print(X.grad)
We have been using fullgraph=True as graph break are problematic in this context.
When a graph break occurs, we need to materialize the NumPy arrays. Since NumPy arrays
do not have a notion of device or requires_grad, this information is lost during
a graph break.
We cannot propagate gradients through a graph break, as the graph break code may execute
arbitrary code that don’t know how to differentiate. On the other hand, in the case of
the CUDA execution, we can work around this problem as we did in the first example, by
using the torch.device("cuda") context manager:
@torch.compile
@torch.compiler.wrap_numpy
def numpy_fn(X, Y):
    prod = X[:, :, None] * Y[:, None, :]
    print("oops, a graph break!")
    return np.sum(prod, axis=(-2, -1))

X = torch.randn(1024, 64, device="cuda")
Y = torch.randn(1024, 64, device="cuda")

with torch.device("cuda"):
    Z = numpy_fn(X, Y)
assert isinstance(Z, torch.Tensor)
assert Z.device.type == "cuda"
During the graph break, the intermediary tensors still need to be moved to CPU, but when the tracing is resumed after the graph break, the rest of the graph is still traced on CUDA. Given this CUDA <> CPU and CPU <> CUDA movement, graph breaks are fairly costly in the NumPy context and should be avoided, but at least they allow tracing through complex pieces of code.
How do I debug NumPy code under torch.compile?
Debugging JIT compiled code is challenging, given the complexity of modern compilers and the daunting errors that they raise. The torch.compile troubleshooting doc contains a few tips and tricks on how to tackle this task.
If the above is not enough to pinpoint the origin of the issue, there are still a few other NumPy-specific tools we can use. We can discern whether the bug is entirely in the PyTorch code by disabling tracing through NumPy functions:
from torch._dynamo import config
config.trace_numpy = False
If the bug lies in the traced NumPy code, we can execute the NumPy code eagerly (without torch.compile)
using PyTorch as a backend by importing import torch._numpy as np.
This should just be used for debugging purposes and is in no way a
replacement for the PyTorch API, as it is much less performant and, as a
private API, may change without notice. At any rate, torch._numpy is a
Python implementation of NumPy in terms of PyTorch and it is used internally by torch.compile to
transform NumPy code into Pytorch code. It is rather easy to read and modify,
so if you find any bug in it feel free to submit a PR fixing it or simply open
an issue.
If the program does work when importing torch._numpy as np, chances are
that the bug is in TorchDynamo. If this is the case, please feel open an issue
with a minimal reproducer.
I torch.compile some NumPy code and I did not see any speed-up.
The best place to start is the tutorial with general advice for how to debug these sort of torch.compile issues.
Some graph breaks may happen because of the use of unsupported features. See
Which NumPy features does torch.compile support?. More generally, it is useful to keep in mind
that some widely used NumPy features do not play well with compilers. For
example, in-place modifications make reasoning difficult within the compiler and
often yield worse performance than their out-of-place counterparts.As such, it is best to avoid
them. Same goes for the use of the out= parameter. Instead, prefer
out-of-place ops and let torch.compile optimize the memory use. Same goes
for data-dependent ops like masked indexing through boolean masks, or
data-dependent control flow like if or while constructions.
Which API to use for fine grain tracing?
In some cases, you might need to exclude small parts of your code from the torch.compile compilations. This section provides some of the answers and you can find more information in TorchDynamo APIs for fine-grained tracing.
How do I graph break on a function?
Graph break on a function is not enough to sufficiently express what you want PyTorch to do. You need to be more specific about your use case. Some of the most common use cases you might want to consider:
If you want to disable compilation on this function frame and the recursively invoked frames, use
torch._dynamo.disable.If you want a particular operator, such as
fbgemmto use the eager mode, usetorch._dynamo.disallow_in_graph.
Some of the uncommon use cases include:
If you want to disable TorchDynamo on the function frame but enable it back on the recursively invoked frames – use
torch._dynamo.disable(recursive=False).If you want to prevent inlining of a function frame – use
torch._dynamo.graph_breakat the beginning of the function you want to prevent inlining.
What’s the difference between torch._dynamo.disable and torch._dynamo.disallow_in_graph
Disallow-in-graph works at the level of operators, or more specifically, the operators that you see in the TorchDynamo extracted graphs.
Disable works at the function frame level and decides if TorchDynamo should look into the function frame or not.
What’s the difference between torch._dynamo.disable and torch._dynamo_skip
Note
torch._dynamo_skip is deprecated.
You most likely need torch._dynamo.disable. But in an unlikely scenario, you
might need even finer control. Suppose you want to disable the tracing on just
the a_fn function, but want to continue the tracing back in aa_fn and
ab_fn. The image below demonstrates this use case:
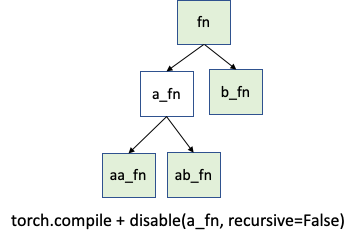
In this case, you can use torch._dynamo.disable(recursive=False).
In previous versions, this functionality was provided by torch._dynamo.skip.
This is now supported by the recursive flag inside torch._dynamo.disable.
