Motivation and Introduction
Across the industry, teams training and serving large AI models face aggressive ROI targets under tight compute capacity. As workloads scale, improving infrastructure effectiveness gets harder because end-to-end runtime increasingly includes overheads beyond “real training” (initialization, orchestration, checkpointing, retries, failures, and recovery).
Meta utilizes Effective Training Time (ETT%) to quantify efficiency, defining it as the percentage of total end-to-end (E2E) wall time dedicated to productive training. This metric directly points to areas where time is wasted, thus facilitating the prioritization of efficiency improvements.
In this work stream, while grounded in Meta’s production experience using PyTorch for model training, we aim to share broadly useful lessons: some improvements have been implemented in open source—e.g., TorchRec sharding plan improvements and PyTorch 2 (PT2) compilation optimizations that reduce compile time and recompilation—while others (like checkpointing and model publishing) are more Meta-specific, but address common industry bottlenecks and can be adapted elsewhere.
Effective Training Time Definition
Effective Training Time (ETT%) is defined as the percentage of E2E wall time spent on consuming new data. Since the end to end wall time depends on many factors such as model architecture, complexity, training data volume etc, it is hard to directly measure Effective Training Time(ETT%). Instead, focus on measuring idleness and failures, which can be represented as following formula:
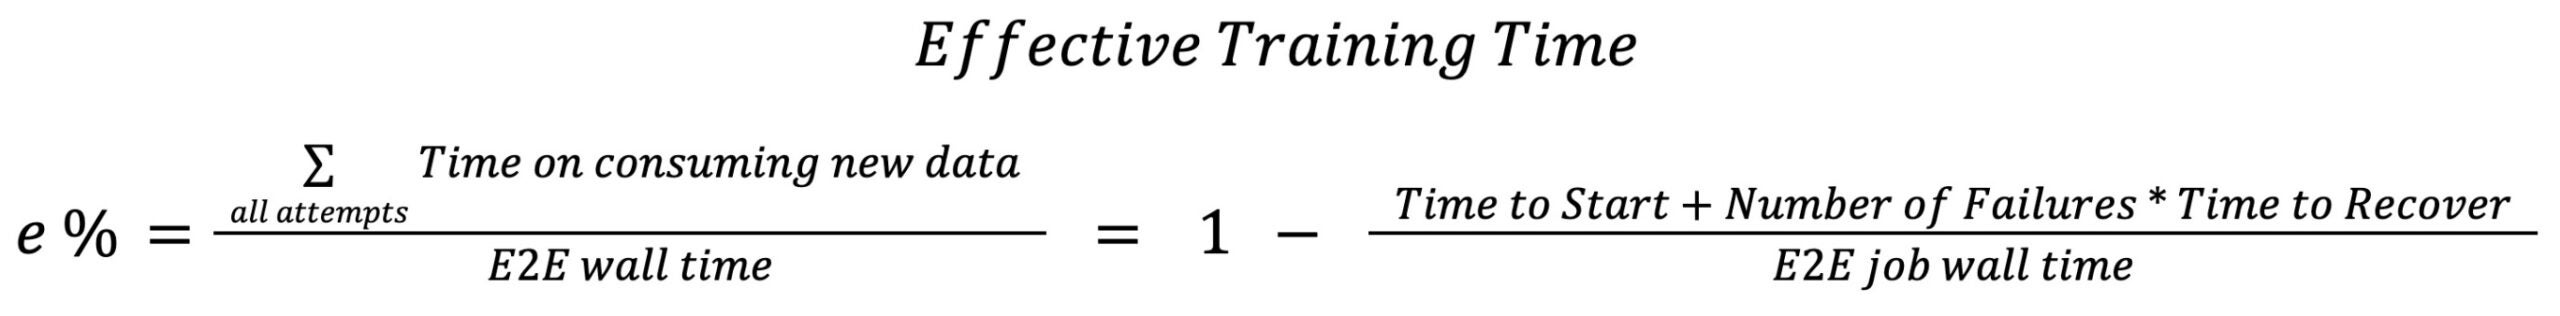
A visual view of the formula is shown below with three L1 sub-metrics:
- Time to Start : the period from when a job is allocated hardware to when it begins training the first batch of data.
- Time to Recover: the duration required for a training job to restart and resume productive training after a failure or interruption.
- Number of Failures: refers to the total count of infra-related interruptions or unsuccessful attempts that occur during the lifecycle of a training job.
Time to Start and Time to Recover are used to measure the idleness of each single attempt from the system optimization perspective and Number of Failure is targeted to measure different kinds of failures from the reliability area.
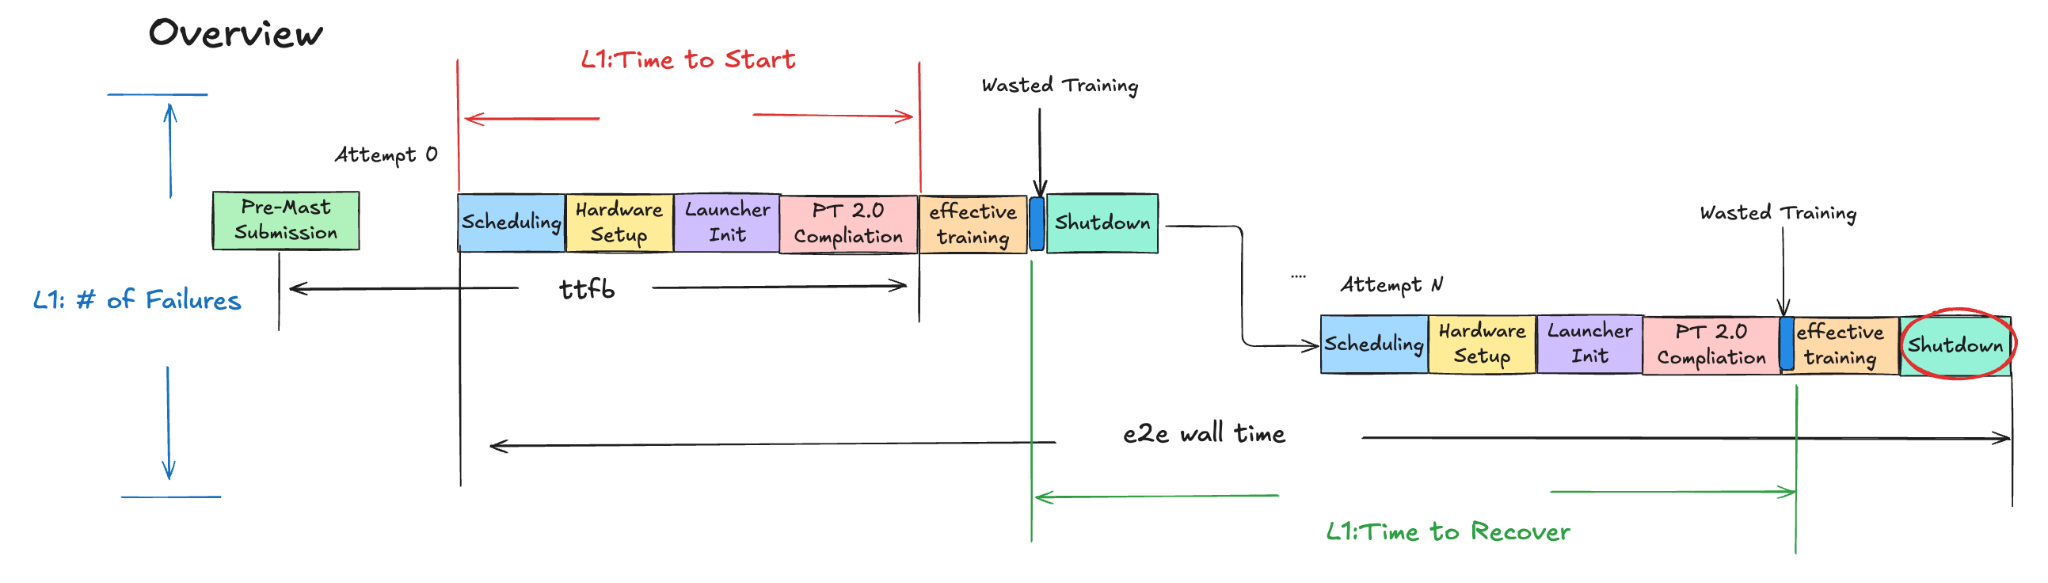
Figure 1. Training Cycle Overview
where the definitions for those L2 area are:
- Scheduling Time: time spent in infra to get a training job scheduled when resources are available.
- Hardware Setup Time: time spent to bring up launcher/trainer binaries in the hardware.
- Launcher Init Time: time to start the launcher to enter into the PT2 compilation stage.
- PT2 Compilation Time: time to apply PT2 compilation to optimize train model before starting to consume training data.
- Effective Training Time: training on time on training data.
- Wasted Training Time: time within the train loop but not consuming new training data such as repeated training on samples and blocked training time etc.
- Shutdown Time: time to stop a training job.
The Journey to Improve ETT% in Meta
Starting from H2’ 24, we have been proactively analyzing the fleetwide Effective Training Time (ETT). This effort aims to establish the ETT% status, identify key focus areas, and implement improvements.
For past years, we have developed more than 40 new technologies in order to improve the overall ETT%. The following diagram shows a brief view on improvement in Time to Start for each main area:
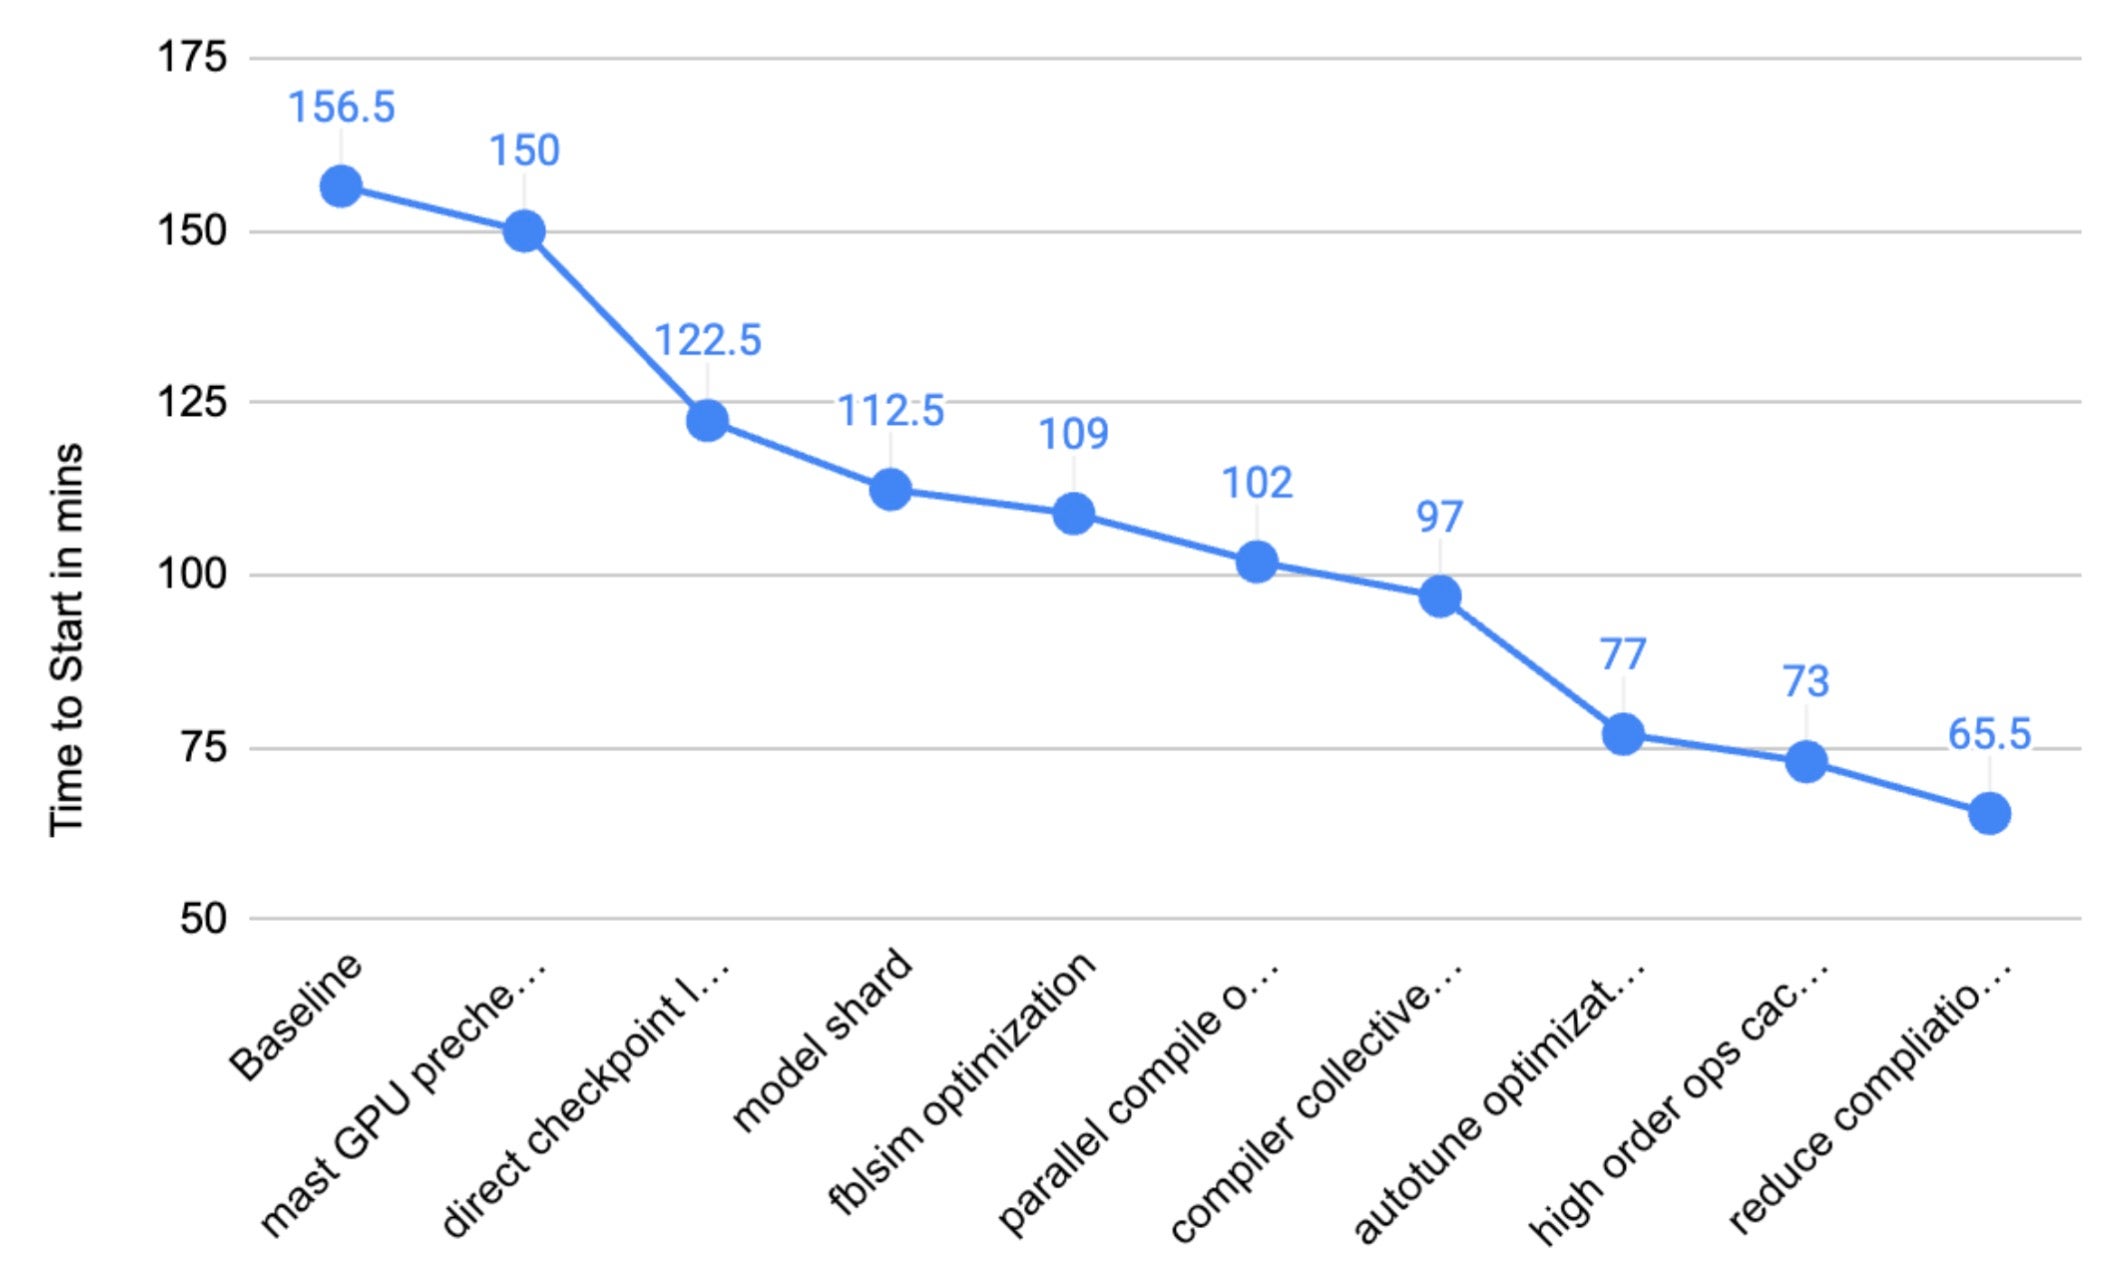
Figure 2. Time to Start Improvement Over Each Techs
With the team’s concentrated efforts, we achieved a major milestone by the end of ’25, successfully increasing the Effective Training Time (ETT%) percentage to >90% for offline training.
Technique Deep-Dives
The team conducted a detailed analysis of each area contributing to the Effective Training Time (ETT%) and focused optimizations primarily on the following initiatives:
- Time to Start and Recover: Optimized trainer initialization and PT2 compilation to lower training costs related to Time to Start and Time to Recover metrics.
- Checkpoint Management: Improved checkpoint processes to minimize idleness during training and reduce unsaved training time.
- Shutdown Time Optimizations: Switched to using CPU machines instead of GPUs for model publishing for inference, resulting in savings on GPU hours for jobs’ shutdown time.
- Failure Reduction and Observability: Collaborated with partner teams to reduce scheduling time and improve the preemption job ratio and established component-level observability and refined the categorization of trainer errors to reduce the frequency of failures.
Trainer Initialization Optimizations
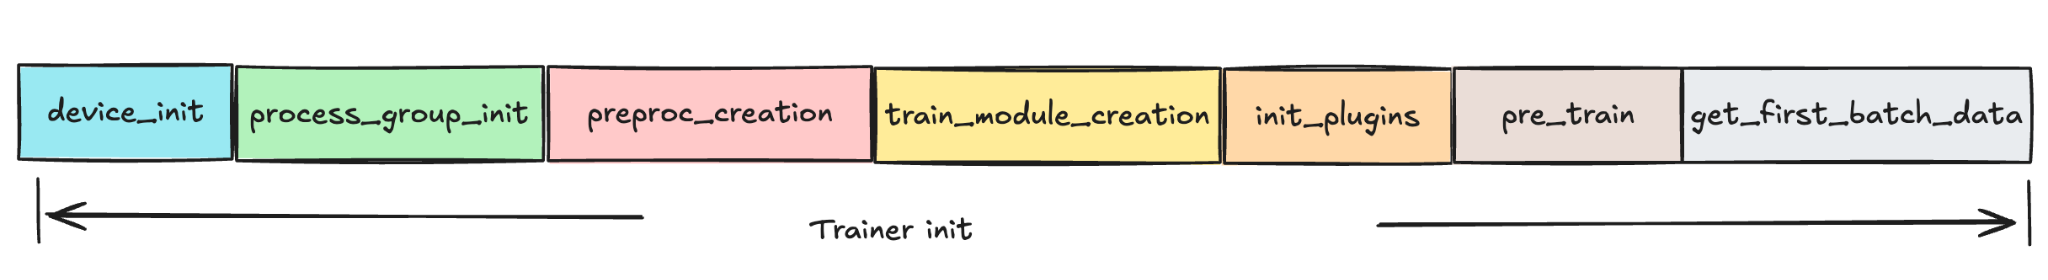 Figure 3. Trainer Initialization Overview
Trainer initialization comprises multiple sub-stages: device_init, process_group_init, preproc_creation, train_module_creation, init_plugins, pre_train, and get_first_batch_data.
Beginning in 2024, we have focused on various initiatives to minimize trainer initialization time. The main methodology we applied is
- Communication optimizations: remove unnecessary creations or communications between each rank to reduce the overhead cost.
- Pipeline Optimizations: for independent processes, run the sub-stage to overlap with each other to maximize the time usage.
Communication Optimizations
Before this work stream, there were numerous unnecessary creations of process groups and non-optimistic communication across different ranks in each job initialization, which collectively contribute to an increase in train initialization time.
For instance, instead of relying on numerous all_gather calls to build shard metadata piece by piece—a method that caused substantial overhead in the sharding process—the team implemented an optimization. They now have each rank build its section of the global rank using metadata that is already locally available after the sharding plan broadcast. This change significantly improved sharding time.
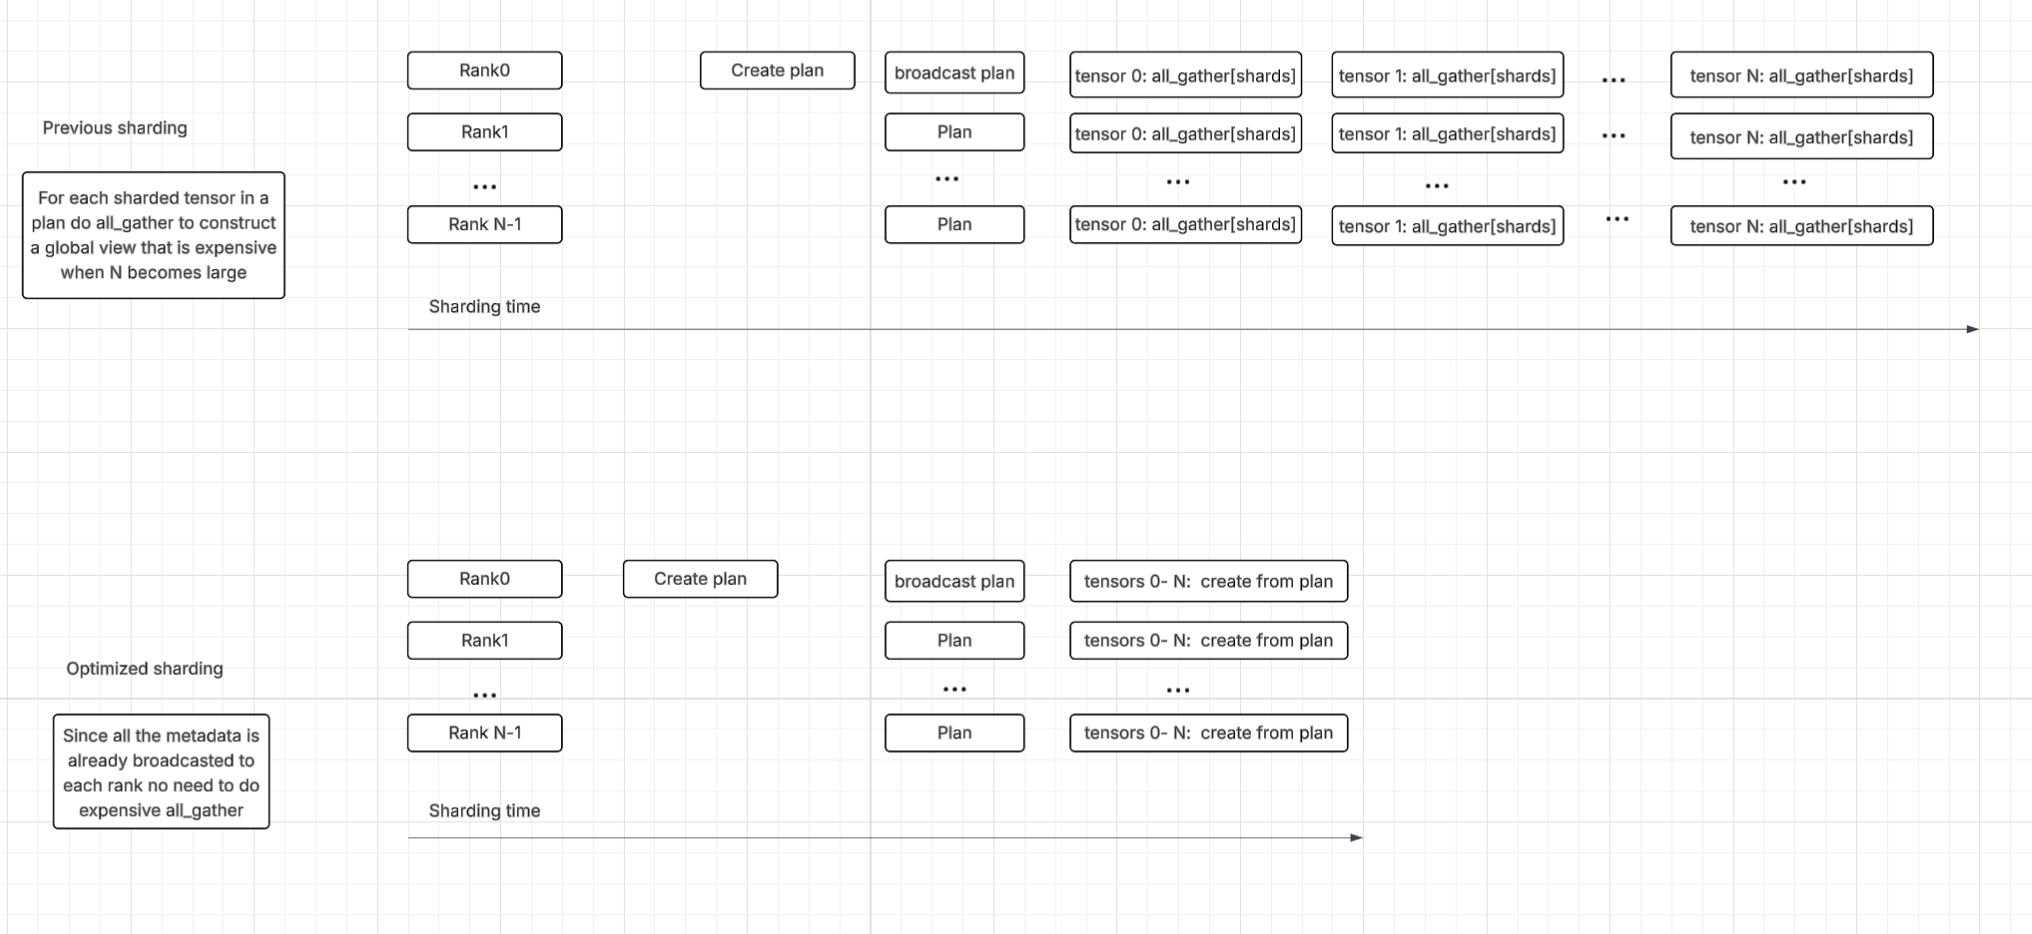 Figure 4. Communication Optimizations Overview
Pipeline Optimizations
Many sub-stages in trainer initialization don’t have dependencies between each other, which allows the room to create separate processes to run the sub-stage to overlap with each other.
For example, the PT2 compilation and DPP warm-up (data process we used to fetch training data) to get the first batch of data, are costly and time-consuming steps that occur before the actual training begins. Currently, the PT2 compilation is delayed, as it can only start once the first batch of real data is available for the compilation process.
In order to enhance the efficiency of this process, we introduced the new technologies to use the fast batch to quickly get the data which allows PT2 to start compiling much earlier while DPP is still fetching the first batch’ data.
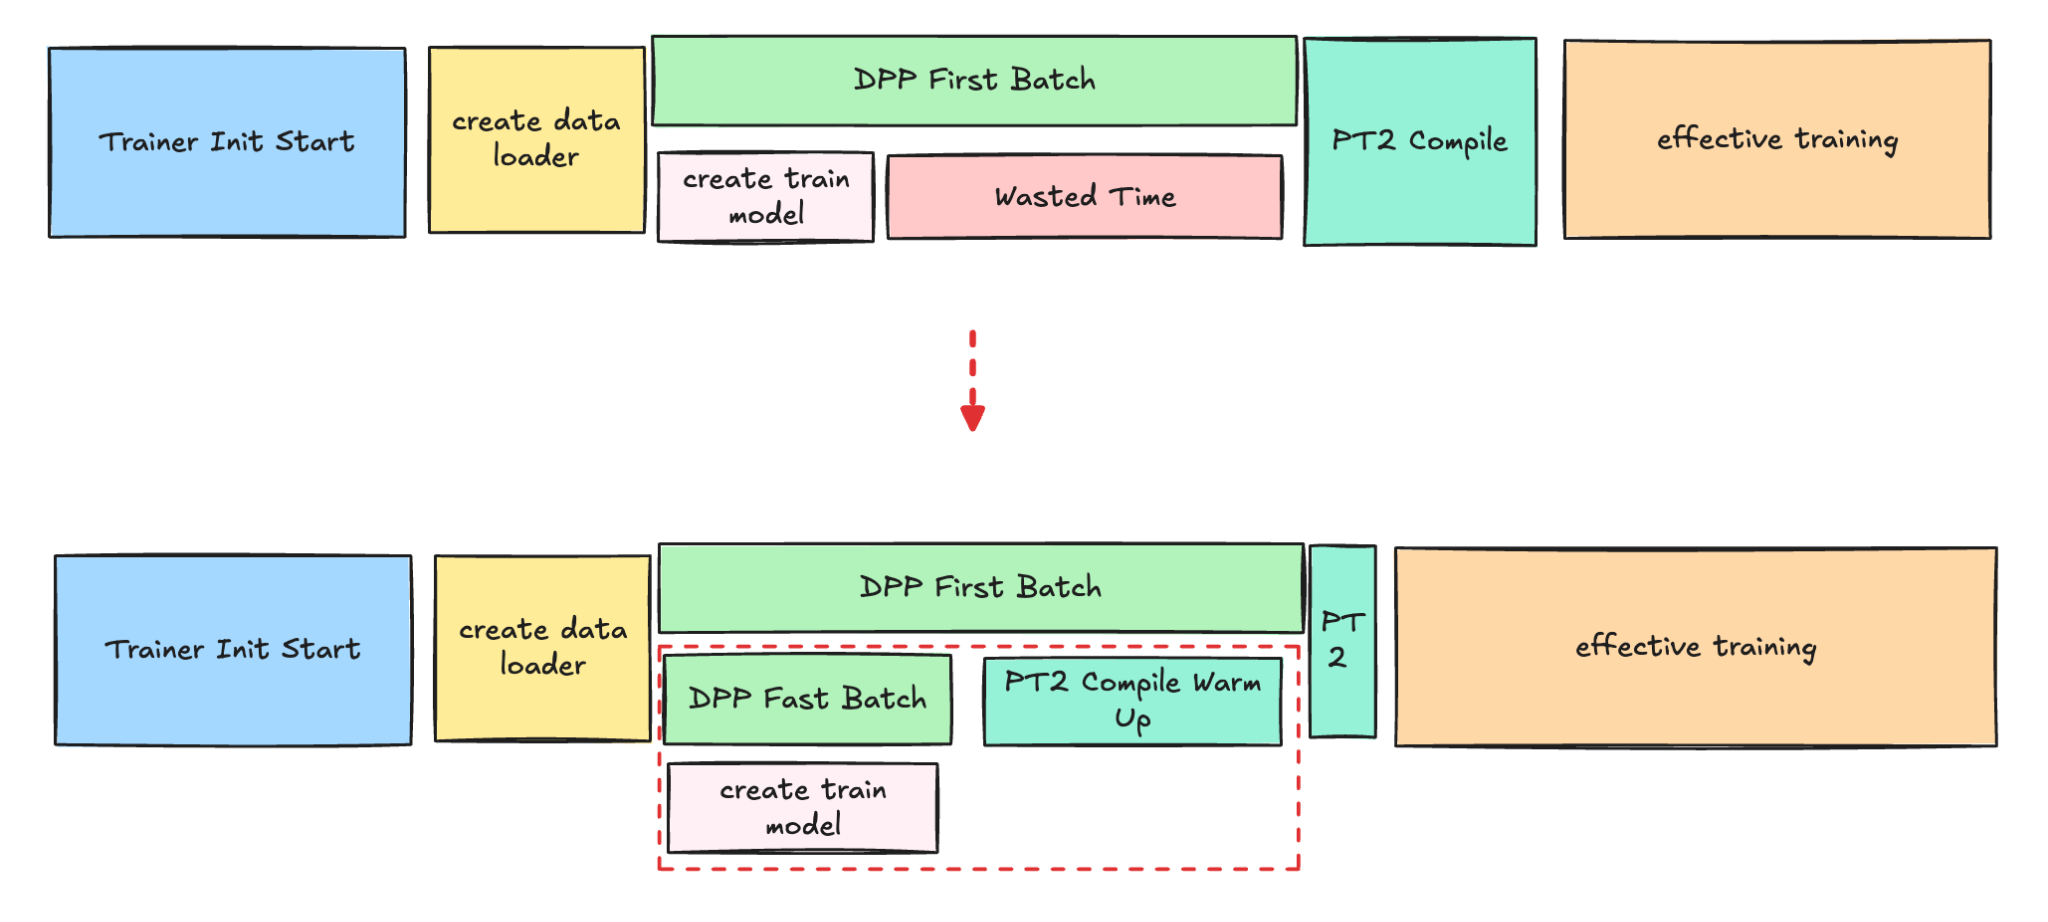 Figure 5. PT2 compilation and DPP warm-up Parallel
This new technology is most beneficial for larger models, such as Foundation Models, because their data loading process is significantly more time-consuming than for other model types.
PT 2.0 Compilation Optimizations
PyTorch 2.0 (PT2) compilation time is another big area where the team invested into. There are 3 main methods we are approaching to reduce the long PT2 compilation time:
- Reduce unnecessary recompilations
- Improve overall PT2 cache hit and coverage
- Reduce large amounts of user defined autotune kernels’ configs
Previously, the team already posted the experience in reducing PT2 compilation time for meta internal workloads, here we just recap the main approaches we did recently and for more details pls refer to the blog.
Reduce unnecessary recompilations
Recompilation due to dynamic shapes is a significant source of overhead in our Meta workloads. This recompilation contributes substantially to the overall compilation time across the fleet, resulting in considerable cumulative cost.
To address this, the v-team collaborated with the Pytorch team in H1 ’25 to develop TORCH_COMPILE_DYNAMIC_SOURCES, which improved the handling of dynamic shapes for parameters by providing an easy and user-friendly way to mark parameters as dynamic without modifying the underlying code. This feature also supports marking integers as dynamic and allows the use of regular expressions to include a broader range of parameters, enhancing flexibility and reducing compilation time.
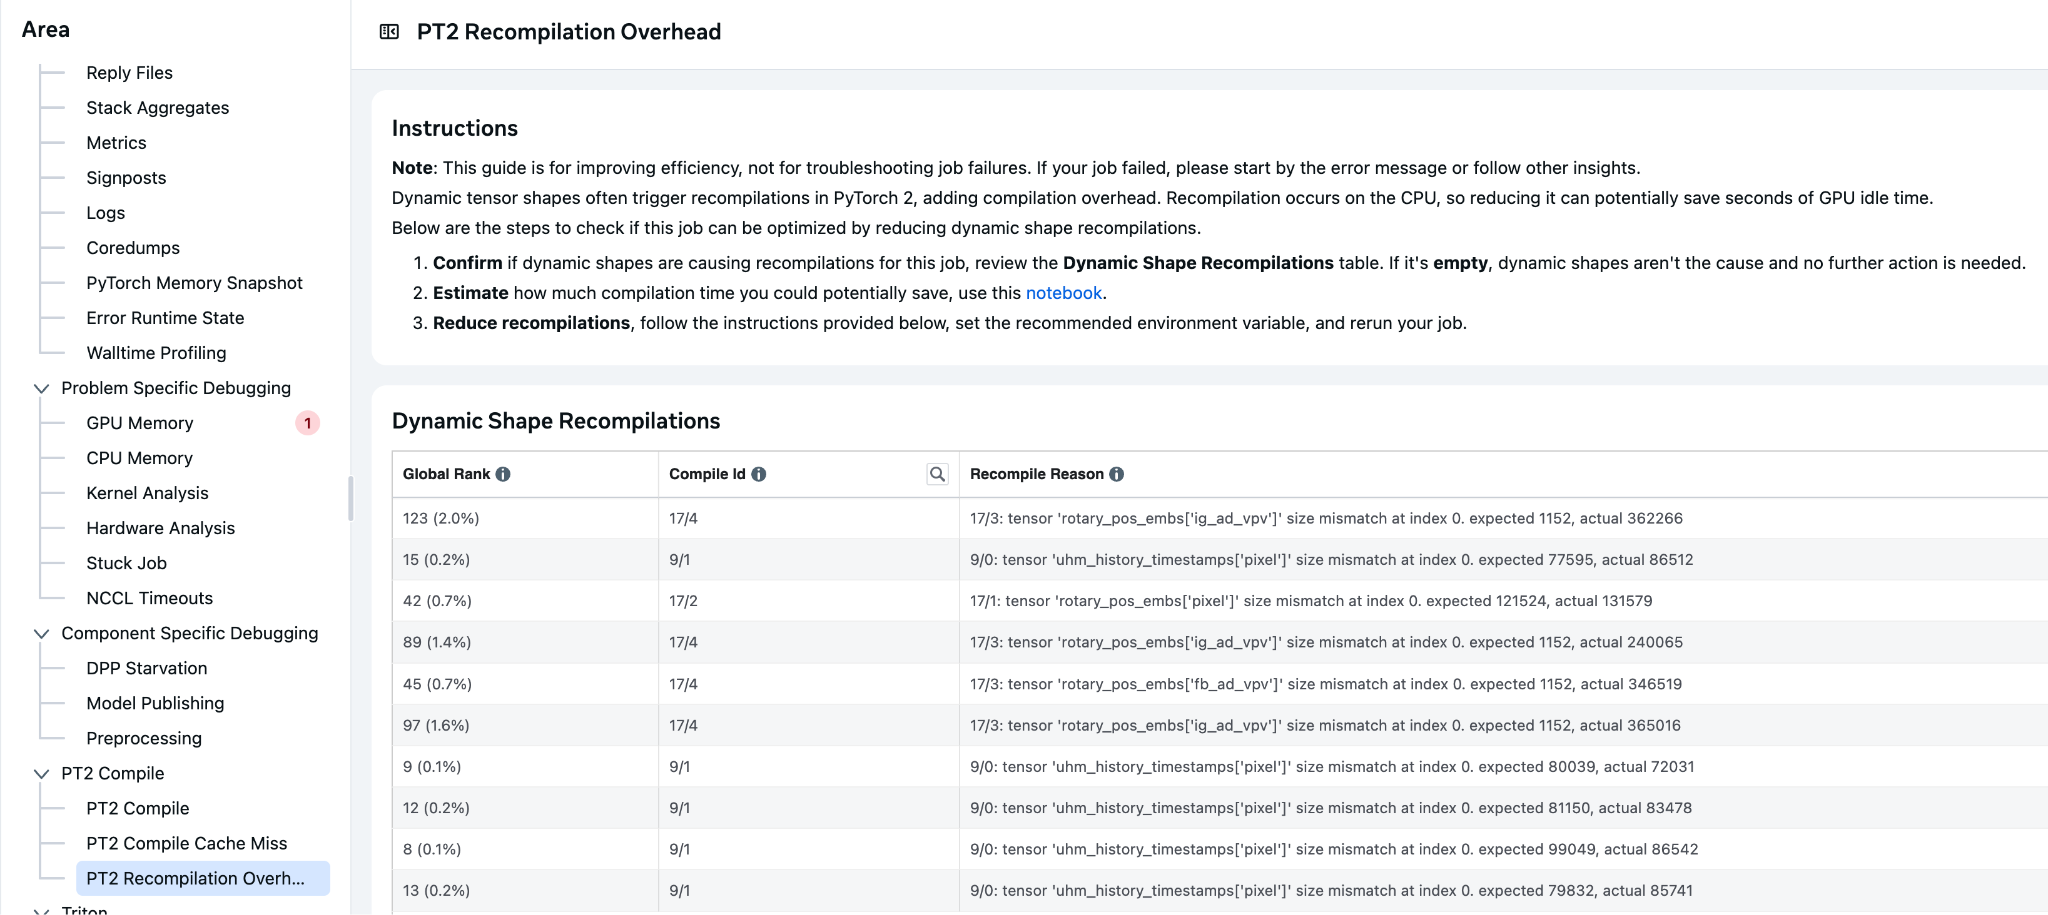
Figure 6. Internal Tool to Identify Dynamic Shape
Improve PT2 Cache
MegaCache brings together several types of PT2 compilation caches—including components like inductor (the core PT2 compiler), triton bundler (for GPU code), AOT Autograd (for efficient gradient computation), Dynamo PGO (profile-guided optimizations), and autotune settings—into a single archive that can be easily downloaded and shared.
By consolidating these elements, MegaCache offers those improvements:
- Minimizes repeated requests to remote servers
- Cuts down on time spent setting up models
- Makes startup and retried jobs more dependable, even in distributed or cloud environments
By the end of 2025, teams worked together to enable the mega cache across all the training platforms. The average PT2 compile time was significantly reduced by approximately 40% due to this effort.
Autotune config pruning
Autotune in PyTorch 2.0 is a feature that automatically optimizes the performance of PyTorch models by tuning various hyperparameters and settings. With the increasing adoption of Triton kernels, the time required to compile and search for the best settings and hyperparameters for Triton kernels has increased.
To address this, we developed a process to identify the most time-consuming kernels and determine optimal runtime configurations for implementation in the codebase. This approach has led to a substantial reduction in compilation time.
Checkpoint Management
Checkpoint: a checkpoint is a saved snapshot of a model’s state during training, including its parameters, optimizer settings, and progress.
At Meta, checkpoints are used to ensure that if a training job is interrupted—due to hardware or software issues—the process can resume from the last saved point rather than starting over.
Checkpoint saving, while necessary, currently blocks GPU training by demanding memory resources, leading to GPU idle time. Furthermore, the time interval between checkpoint saves directly impacts the amount of training progress that is lost (unsaved training time) if a failure occurs.
To address these inefficiencies, the team successfully developed and implemented Async Checkpointing and PyTorch Native Staging. These advancements have significantly improved checkpointing performance by reducing the checkpoint blocking time for all models.
Async checkpointing: it involves creating a copy of the checkpoint in CPU memory, allowing the main trainer process to resume the training loop while a background process completes the checkpoint upload.
PyTorch native staging: the initial async checkpoint implementation used custom C++ staging, which was designed to minimize trainer memory usage during staging by utilizing streaming copy. The checkpointing team has developed a separate async checkpointing solution using PyTorch native staging APIs which allows improved save blocking time at the cost of increased trainer memory consumption.
These improvements were achieved by significantly reducing the total daily GPU hours blocked for checkpointing.
Reducing Wasted Training Time
Optimizing the time required to save checkpoints directly boosts the Effective Training Time (ETT) percentage by reducing interruptions to the training loop. Furthermore, these checkpoint save improvements can unlock greater ETT% gains when paired with adjustments to the checkpoint interval.
Adjusting the checkpoint interval impacts two components of wasted training time:
Unsaved Training Time: this is the training progress lost after a job failure, as any work completed since the last checkpoint is discarded.
- Calculation: (# train loop failures) * (checkpoint interval)/2
Checkpoint Save Blocking Time: this is the time the training loop is paused specifically while a new checkpoint is being created.
- Calculation: ((time spent in train loop) / (checkpoint interval)) * (blocking time per checkpoint)
With the job failure rate, the checkpoint interval can be tuned to minimize the expected wasted training time, equal to:
sum(unsaved training time, checkpoint save blocking time)
The following graph illustrates the relationship between checkpoint save intervals and the percentage of wasted training time (WTT%), using a hypothetical scenario with a 15-second checkpoint save blocking time and 3 daily failures.
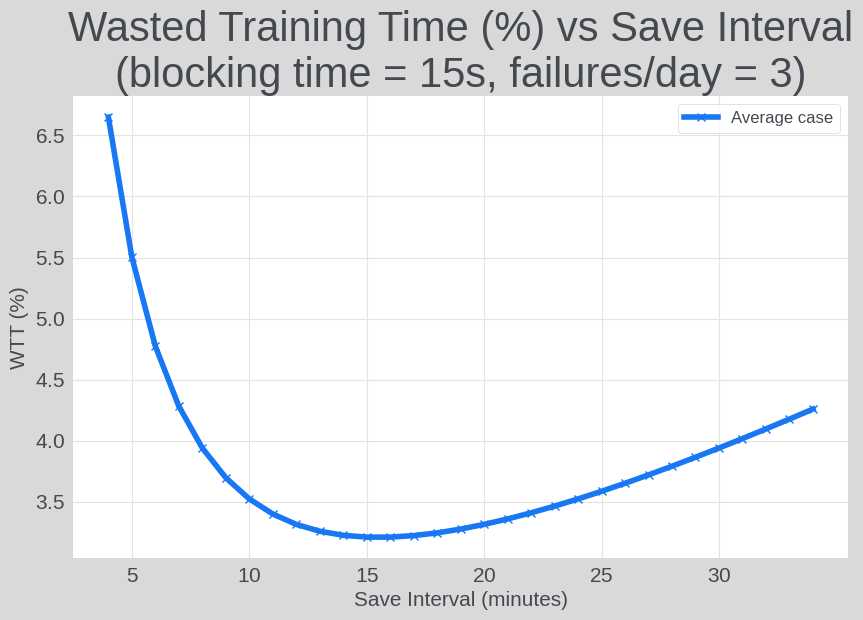 Figure 7. Checkpoint Save Interval vs Wasted Training Time
By optimizing the checkpoint saving interval, the team successfully reduced the unsaved training time for both production and exploration jobs.
Shutdown Time Optimizations
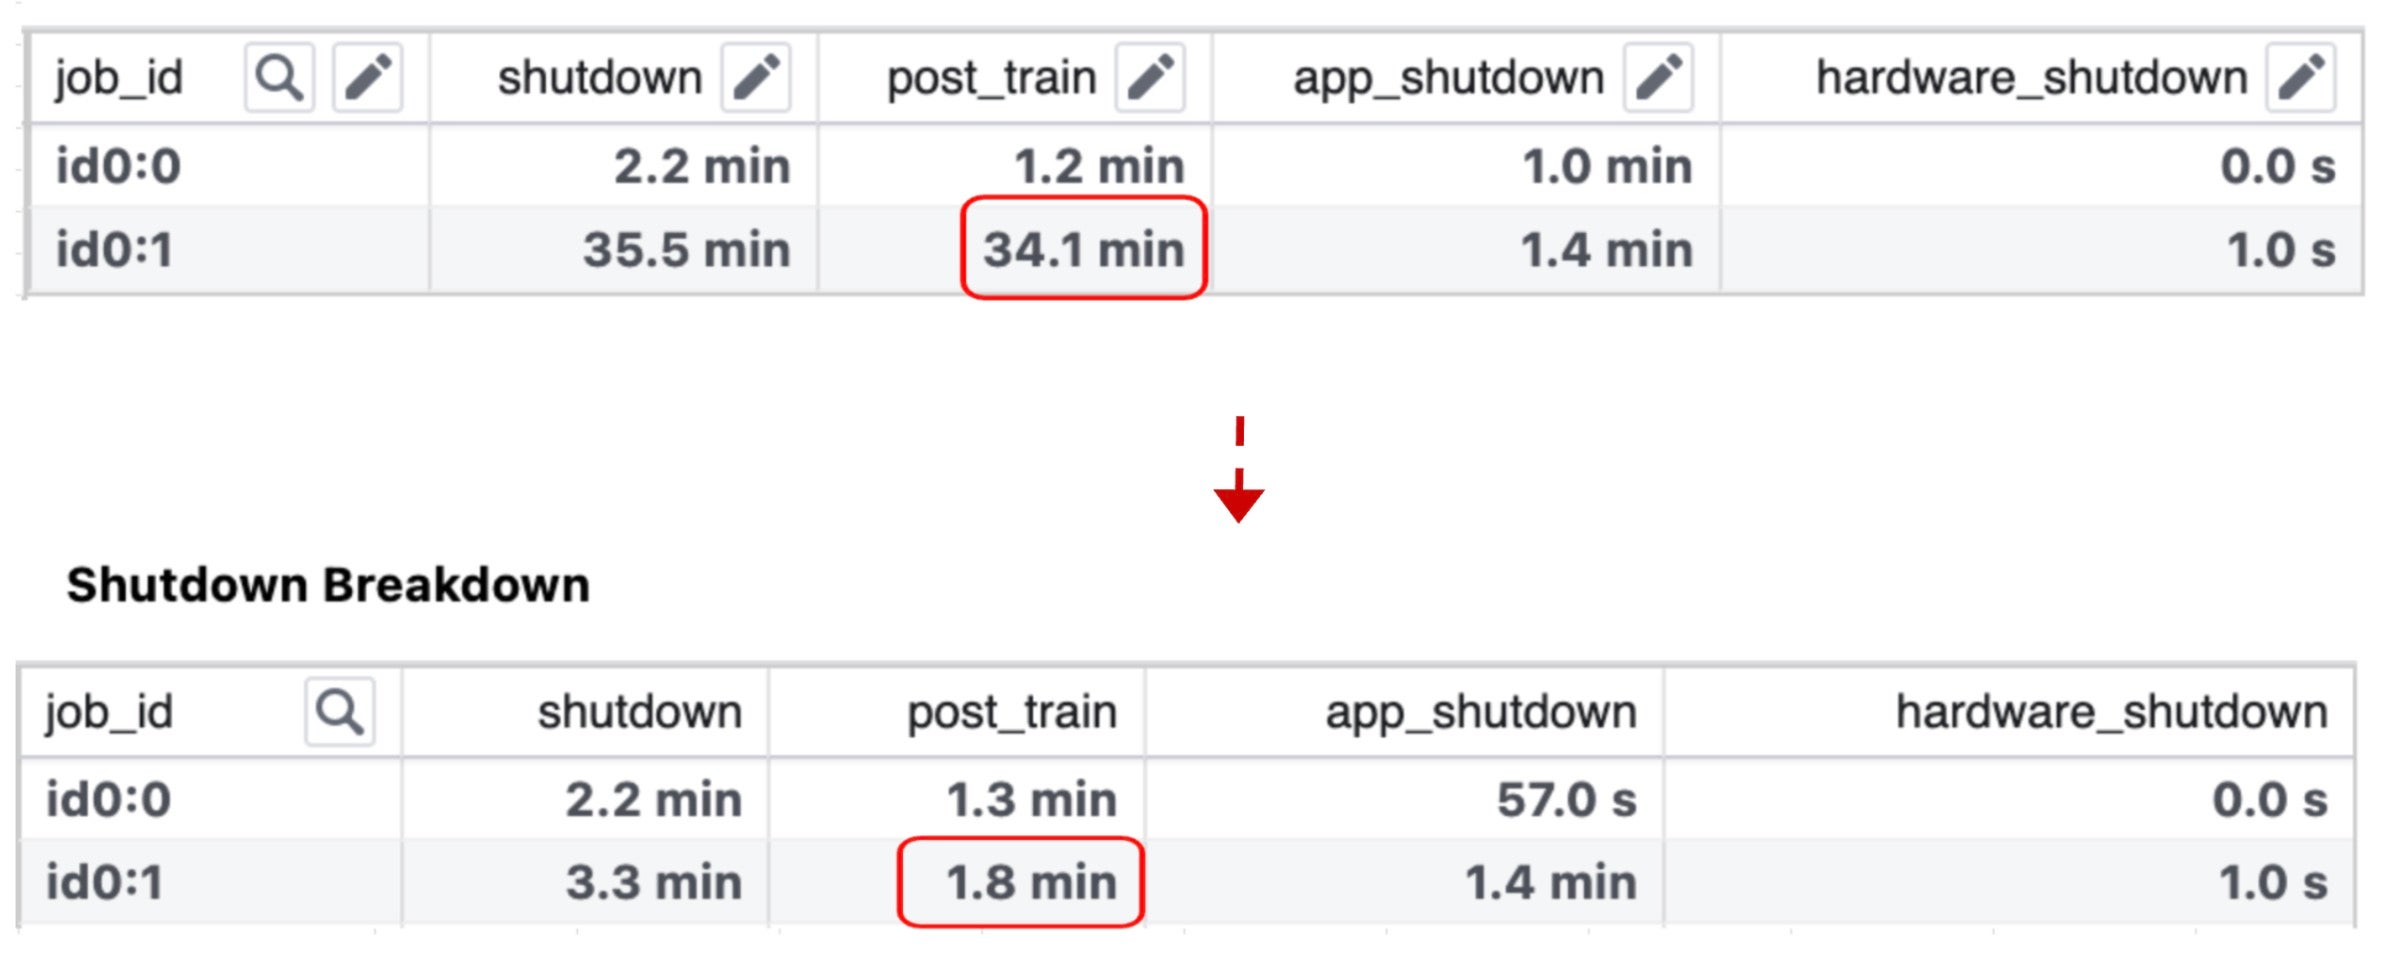
The team dived into each component of the shutdown phase, and found that the model publish processing (model publishing for inference) dominated the post-train process duration.
Model Publish Processing: Model publishing is the process of optimizing a model using processing code to create an inference-ready snapshot to serve inference.
The team’s analysis led to the adoption of a standalone publishing strategy, which decouples publishing from the training process. With this approach, publishing is initiated only after the training job has finished and created an anchor checkpoint. This checkpoint is then used by a model processing job, leveraging the stored data, to generate the final inference-ready snapshot.
The key differences between this standalone publishing method and the traditional “trending end” model publishing are visually represented in the diagram below.
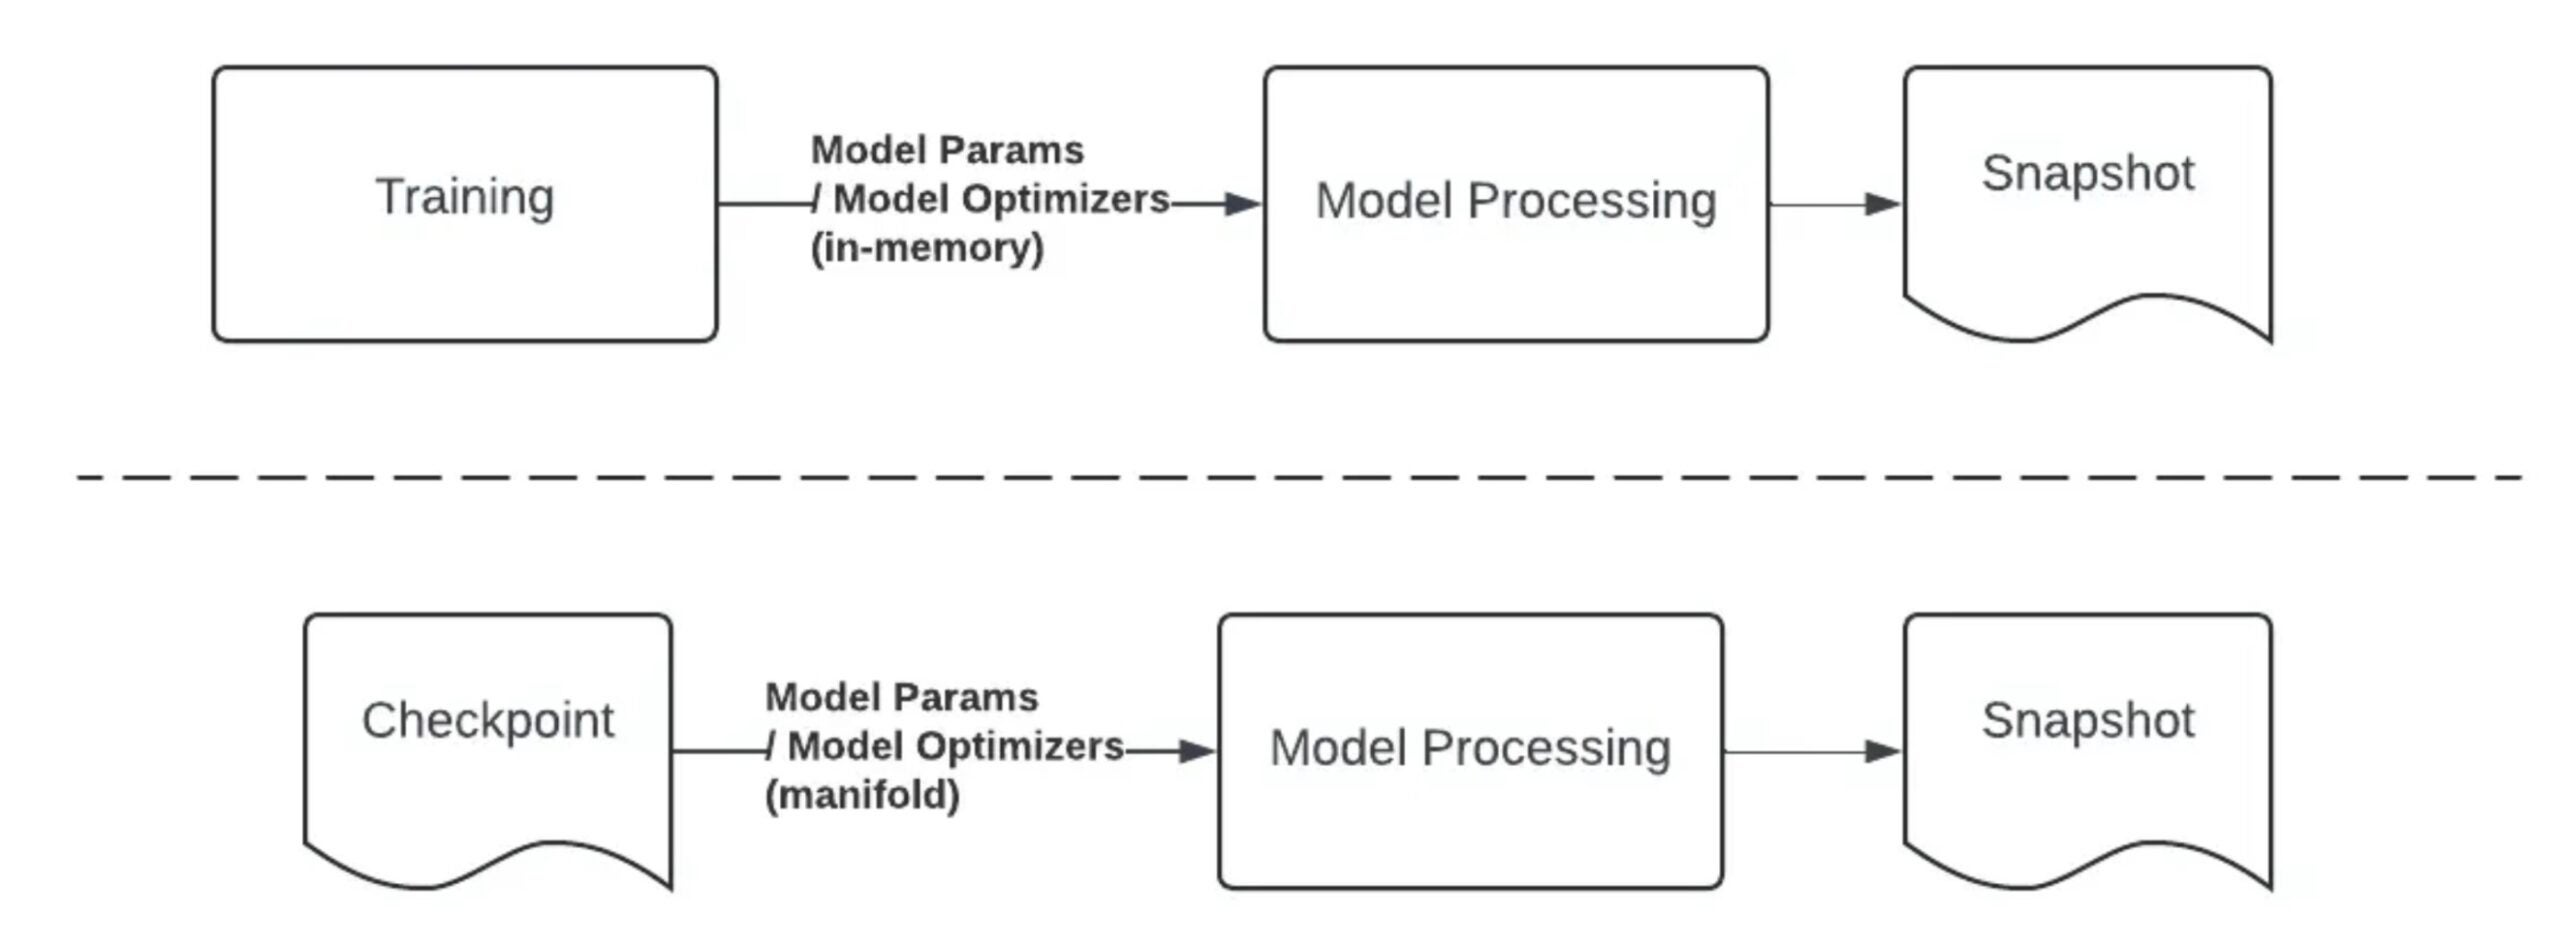
Figure 8. “Trending End” Model Publish vs Standalone Publish
The implementation of the new model publishing pipeline has successfully shortened the shutdown time for each job by approximately 30 minutes.
Failure Reduction and Observability
A major focus area for the team has been failure reduction, as the number of failures significantly impacts the overall Effective Training Time (ETT) percentage. Regressions from code or configuration changes can directly cause this percentage to drop.
Fluctuations in the ETT dashboard are primarily attributed to two factors:
- Increased Job Preemptions: A higher volume of running jobs leads to more preemptions.
- Service Regressions: Issues with services cause a greater number of job failures.
To tackle preemptions, we are collaborating with infrastructure teams to develop a new scheduling algorithm aimed at lowering the preemption ratio without negatively affecting users’ quotas or experience.
Regarding failure reduction, a dedicated team is scrutinizing each ETT-related component and building dashboards to monitor overall ETT performance, including Time to Start/Time to Restart (TTS/TTR), unsaved training time, and checkpoint saving time. This proactive monitoring ensures that any regression is detected and mitigated early within the SLA.
In the End
As model training scales, resource constraints are becoming a defining challenge across the industry. For years, a major lever for improving training efficiency has been increasing Model FLOPs Utilization (MFU) through techniques like model co-design and kernel optimization. That work remains essential, but large-scale training has surfaced a complementary bottleneck: significant GPU time is spent idle outside the steady-state training loop.
Our analysis shows that non-training overhead can be substantial especially on some of the largest runs.
To address this, we launched a successful workstream focused on improving Effective Training Time (ETT%), which has already produced meaningful capacity savings. The key takeaway for practitioners is simple: to improve cost and throughput at scale, you must optimize the “in-between” phases—not just the training steps.
Since our training stack utilizes PyTorch, we made an effort to ensure these enhancements are applicable beyond a single environment. We have open-sourced and shared relevant building blocks, such as those in TorchRec and PyTorch 2, within the open-source PyTorch ecosystem. This allows others to leverage these improvements, replicate our results, and build upon our work. Other components, like model publishing and checkpointing, are more specific to Meta but tackle common industry challenges and can be adapted for use elsewhere.
We hope these lessons help teams diagnose similar bottlenecks, apply ETT%-style measurement, and contribute further improvements back to the ecosystem.
Acknowledgements
We extend our gratitude to Max Leung, Apoorv Purwar, Musharaf Sultan, John Bocharov, Barak Pat, Jonathan Tang, Vivek Trehan, Chris Gottbrath and Vitor Brumatti Pereira for their valuable reviews and insightful support. We also thank the entire Meta team responsible for the development and productionization of this workstream.