Reviewers: Yunsang Ju(Naver GplaceAI Leader), Min Jean Cho(Intel), Jing Xu(Intel), Mark Saroufim(Meta)
Intro
Here, We will be sharing our experience in moving AI workloads from our GPU servers to our Intel CPU servers without any performance or quality degradation, and saving annual costs of approximately 340 thousand U.S. Dollar (refer to the Conclusion) in the process.
We aim to provide value to our consumers by serving various AI models that enhance the Online to Offline (O2O) experience. With the ongoing growth in the demand for new models and the limited nature of high-cost resource GPUs, we needed to transition relatively lightweight AI models from GPU servers to Intel CPU servers for reducing resource consumption. In the same setting, however, the CPU server had issues where performance of rps, inference time, etc. was reduced by tens of times. We applied various engineering techniques and lightweighted the model to solve this problem, and we were able to successfully transition to the Intel CPU servers with the same performance or better performance as the GPU servers with just a three-fold scale out.
For a more detailed introduction about our team, please refer to the Introduction to NAVER Place AI Development Team.
I’ll mention it again in the middle, but I’ve received a lot of help from Grokking Pytorch Intel CPU Performance From First Principles written by Intel and PyTorch in the overall work.
Problem Definition
1: Service Architecture
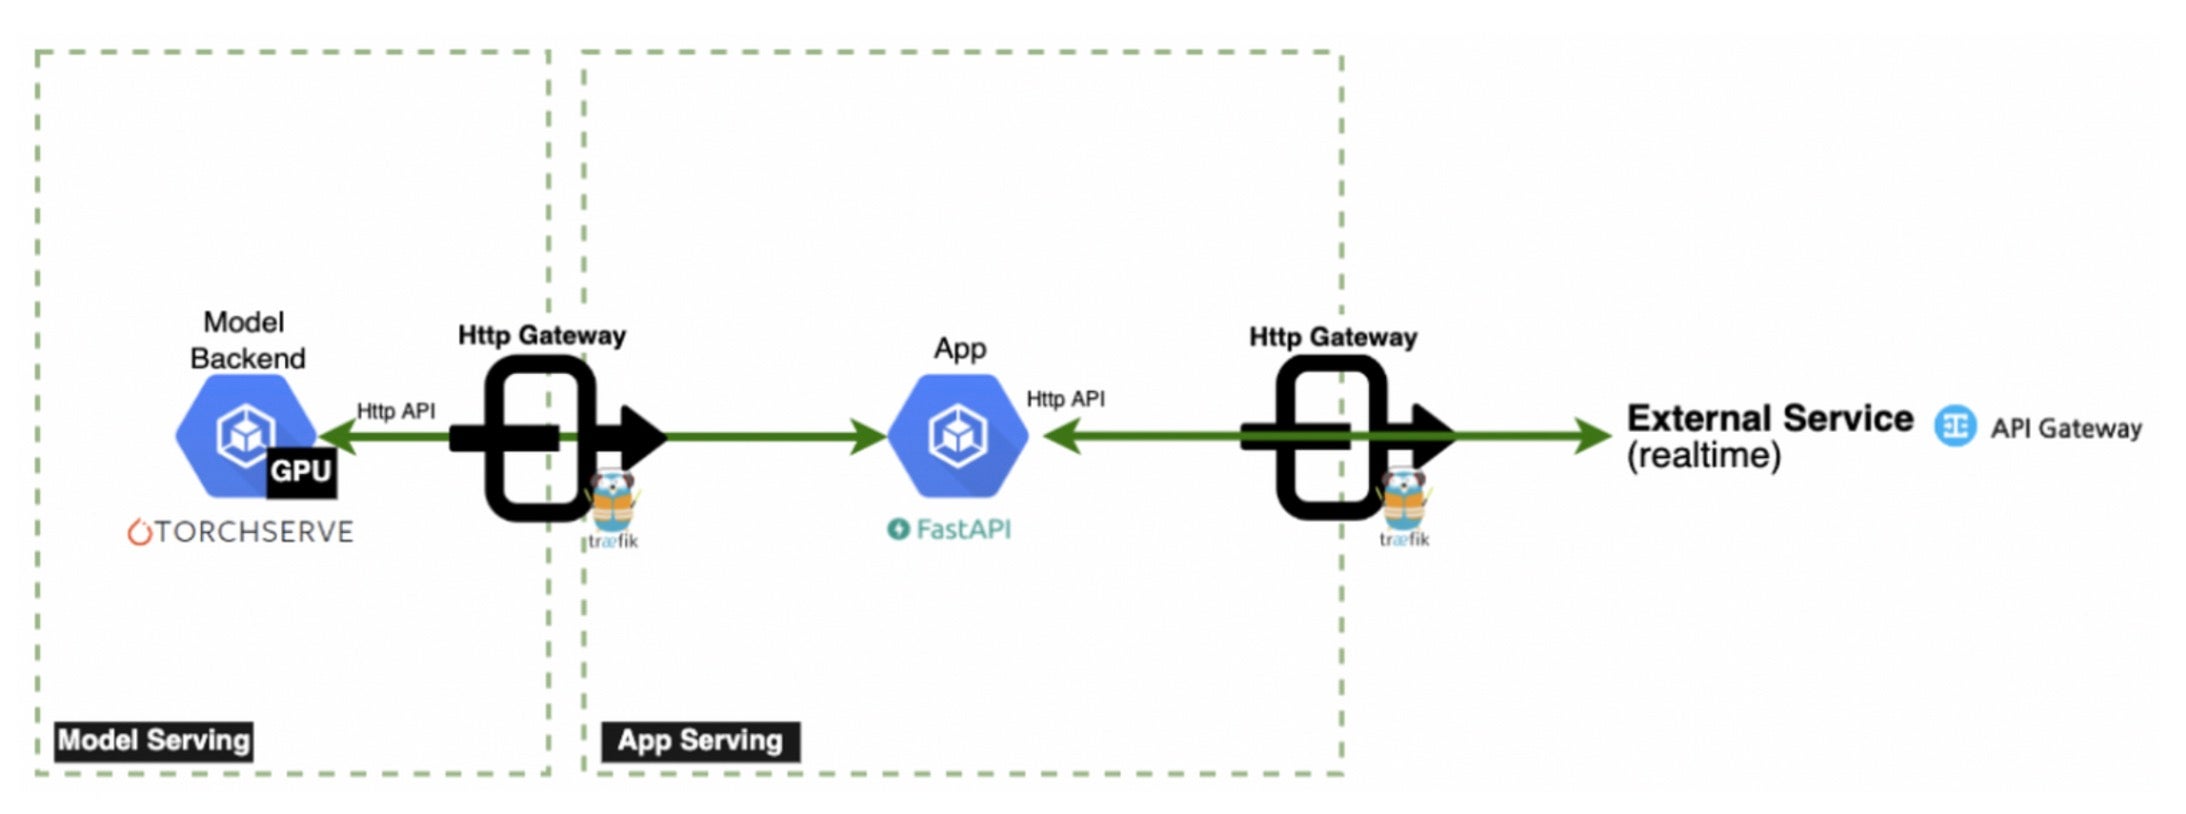
Simplified service architecture (Image Source: NAVER GplaceAI)
To facilitate understanding, a brief introduction to our service architecture will be provided. CPU intensive tasks such as preprocessing input to tensor format (then forwarded to the model) and post processing inference results to human readable output (e.g. natural language and image formats) are performed on the App Server(FastAPI) The Model Server(TorchServe) exclusively handles inference operations. For stable operation of the service, the following actions need to be performed with sufficient throughput and low latency.
The specific processing sequence is as follows:
- The client submits a request to the app server via the Traefik gateway.
- The app server pre-processes the input by performing actions such as resizing and transforming, and converting it into a Torch tensor before then requesting the model server.
- The model server performs inference and returns the feature to the app server
- The app server converts the feature into a format understandable by humans through post-processing and returns it to the client
2: Throughput and Latency Measurement
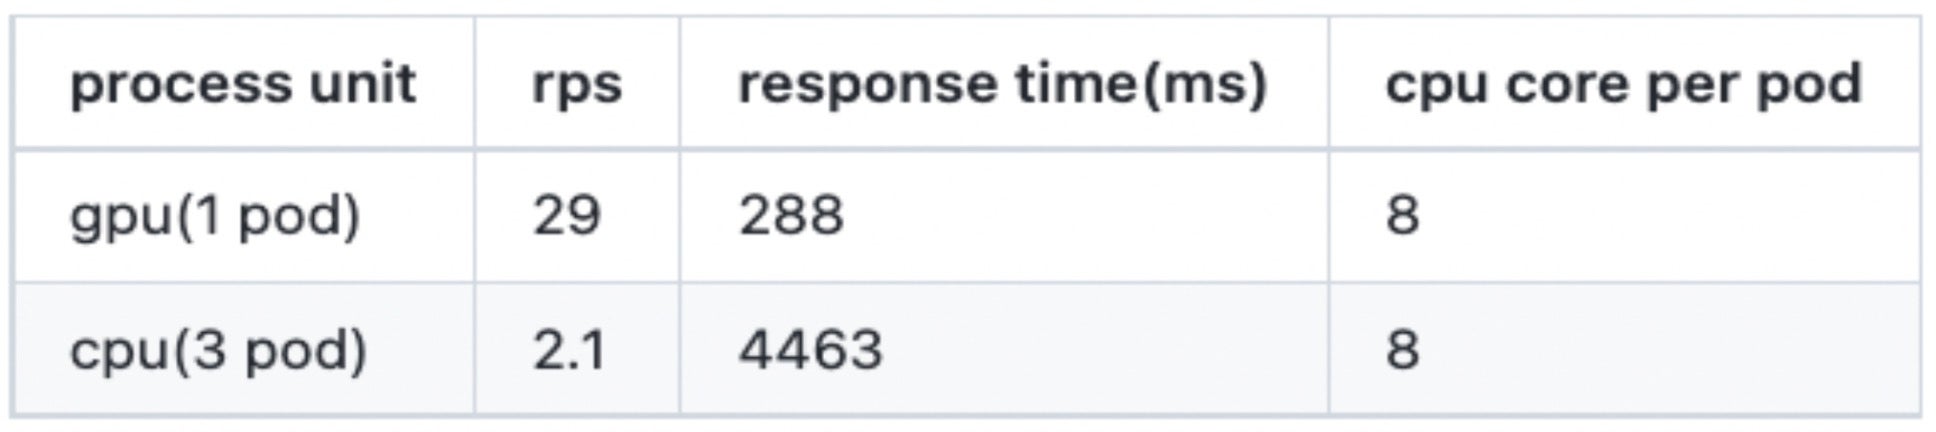
Comparison of Image Scoring Models
With all other conditions remaining the same, deploying on a threefold increase CPU server pod, yet, notably, the RPS (requests per second) and response time deteriorated by more than tenfold. While it was not surprising that CPU inference performance is inferior to GPUs, the challenging situation was evident. Given the goal of maintaining performance within limited resources, achieving an approximate 10 to 20 times performance improvement was necessary Barring any additional scaling.
3: Challenges From a Throughput Perspective
Type     Name                                                                          # reqs      # fails |    Avg     Min     Max    Med |   req/s  failures/s
--------|----------------------------------------------------------------------------|-------|-------------|-------|-------|-------|-------|--------|-----------
POST     /predictions/image-scoring                                                        37     0(0.00%) |   9031    4043   28985   8200 |    1.00        0.00
--------|----------------------------------------------------------------------------|-------|-------------|-------|-------|-------|-------|--------|-----------
         Aggregated                                                                        37     0(0.00%) |   9031    4043   28985   8200 |    1.00        0.00
One of the first steps TorchServer framework users might take in order to improve throughput is to increase the number of workers in TorchServe. This approach is effective on GPU servers Because of parallel workload processing, excluding the linear memory usage increase as workers scale. However, we were experiencing worse performance when increasing the number of workers. Identifying the cause of performance degradation on CPU servers required further investigation.
4: Challenges From a Latency Perspective
Our primary concern was latency. Throughput improvement is normally achievable when a system’s implementation is faithful to scale-out principles, except for perhaps very rare worst-case scenarios. However, in the case of the Image Scoring model example, even performing a single inference took more than 1 second, and as the request volume increased, latency increased to as much as 4 seconds. It was a situation where the timeout criteria to satisfy the client could not be met even with a single inference.
Proposed Solutions
Improvements were needed from both an ML and an engineering perspective. It was essential to fundamentally reduce the inference time on the CPU and to identify the causes of performance degradation when applying config that generally enhances performance, in order to find the optimal configuration values. To accomplish this, collaboration was established with MLE professionals to concurrently execute tasks encompassing ‘model lightweighting without compromising performance’, and ‘Identify optimal configurations for achieving peak performance’. Using the aforementioned approaches we were able to effectively transition workload handling to our CPU servers.
1: Resolving Low RPS from an Engineering Perspective
First, the reason for performance degradation even after increasing the worker number was the front-end bound caused by logical threads in GEMM operations. Generally, when increasing the number of workers, the expected improvement effect is the increase in parallelism. Conversely, if performance decreases, one can infer the corresponding trade-off effect.
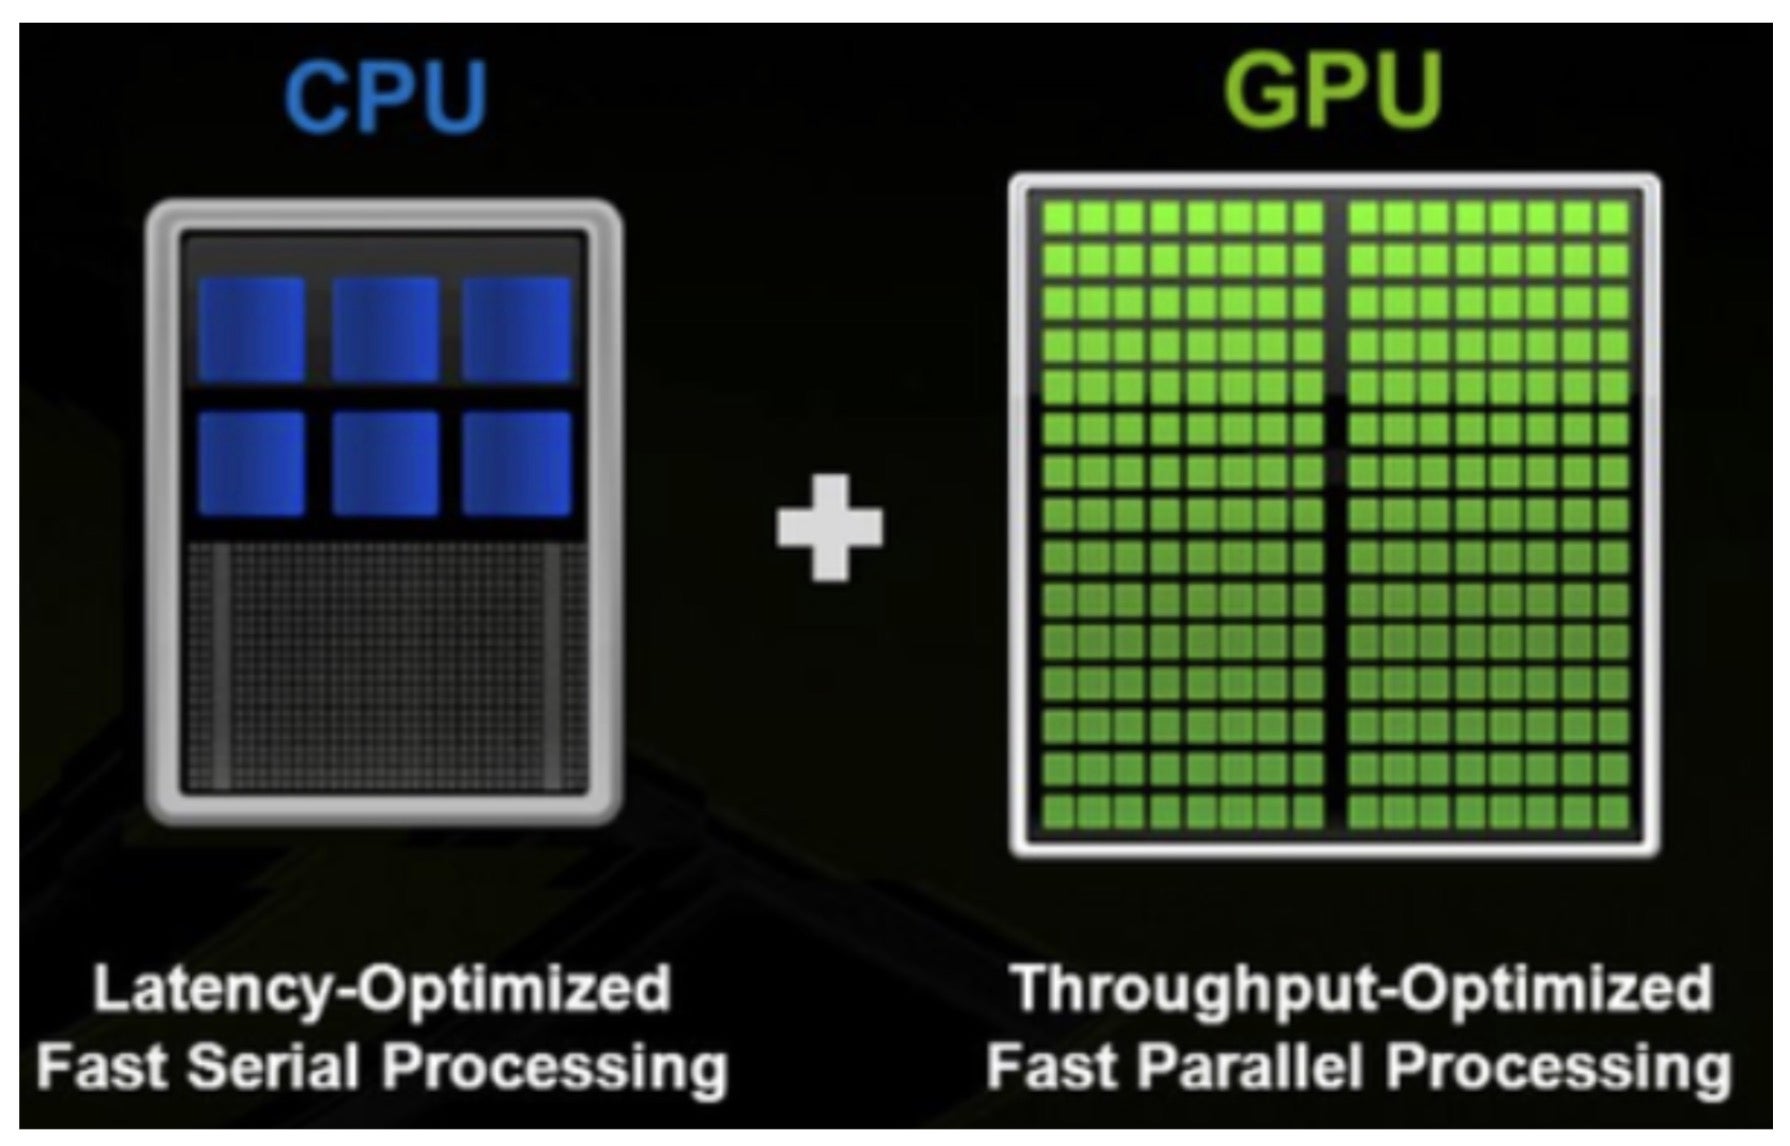
Image Source: Nvidia
As many are aware, the reason model inference performance on CPUs is inferior to GPUs lies in the difference in hardware design, particularly in terms of multi-threading capabilities. Diving deeper, model inference is fundamentally a repetition of GEMM (General Matrix Multiply) operations, and these GEMM operations are executed independently in “fused-multiply-add” (FMA) or “dot-product” (DP) execution units. If the GEMM operation becomes a bottleneck on the CPU, increasing parallelism might actually result in decreased performance. While researching the problem we found relevant information within the PyTorch documentation.
While two logical threads run GEMM at the same time, they will be sharing the same core resources causing front-end bound
This information highlighted that logical threads could cause a bottleneck in CPU GEMM operations, which helped us intuitively understand why performance decreased when increasing the worker num. This is because the default value of the torch thread corresponds to the physical core value of the CPU.
root@test-pod:/# lscpu
  …
Thread(s) per core: 2
Core(s) per socket: 12
  …
root@test-pod:/# python
>>> import torch
>>> print(torch.get_num_threads())
24
When the worker_num increases, the total thread count increases by the product of the physical core * worker number. Consequently, logical threads are utilized. In order to improve performance, the total number of threads per worker was adjusted to align with the physical core count. Below, it can be observed that the metric RPS increased approximately threefold to 6.3(from the previous value of 2.1) when the worker_num was increased to 4 and the total thread count was aligned with the number of physical cores.
Type     Name                                                                          # reqs      # fails |    Avg     Min     Max    Med |   req/s  failures/s
--------|----------------------------------------------------------------------------|-------|-------------|-------|-------|-------|-------|--------|-----------
POST     /predictions/image-scoring                                                       265     0(0.00%) |   3154    1885    4008   3200 |    6.30        0.00
--------|----------------------------------------------------------------------------|-------|-------------|-------|-------|-------|-------|--------|-----------
         Aggregated                                                                       265     0(0.00%) |   3154    1885    4008   3200 |    6.30        0.00
Cautionary Note 1: Our team is Using Kubernetes to maintain our deployments. So we are adjusting the which required us to adjust according to the CPU resource limit of the pod, rather than the physical core count of the node that can be checked using the lscpu command. (Setting the torch thread of each worker to 8/4 = 2, or 24/4 = 6 resulted in performance degradation.)
Cautionary Note 2: Since torch thread settings for each worker can only be configured as integers, it’s advisable to set the CPU limit divisible by the worker_num in order to adequately utilize CPU usage.
ex) core=8, In the case of worker_num=3: int(8/worker_num) = 2, 2*worker_num/8 = 75%
ex) core=8, In the case of worker_num=4: int(8/worker_num) = 2, 2*worker_num/8 = 100%
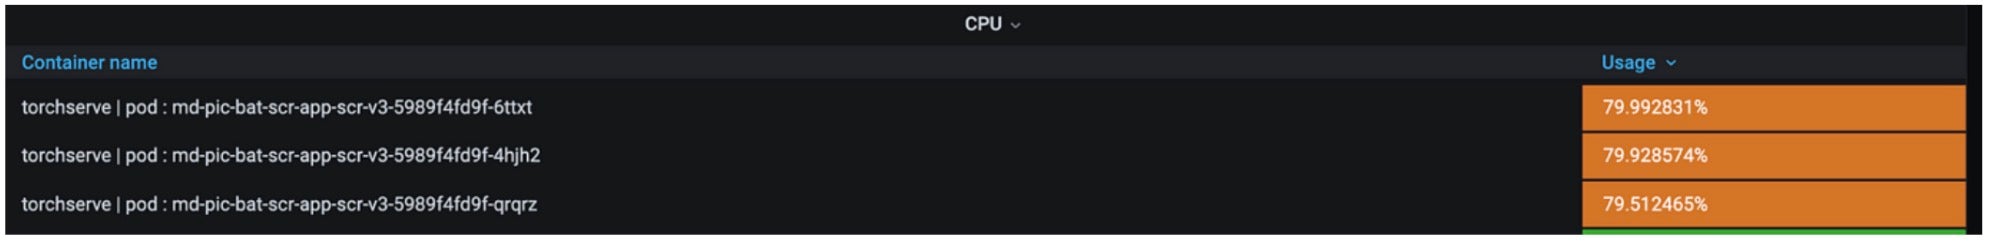
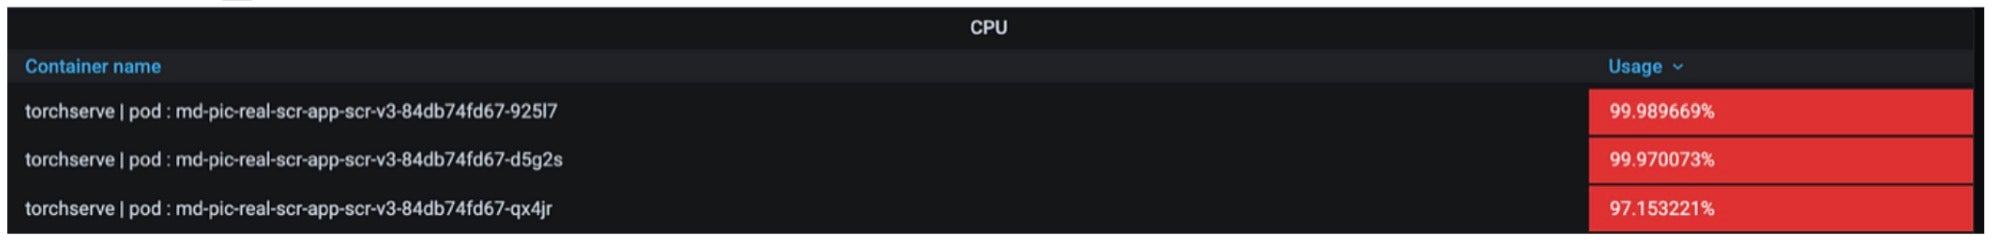
We also analyzed the model containers to see why we got a mere threefold improvement in performance despite a four times increase in the number of workers. Various resources were monitored, and among them, the core utilization rate was identified as the underlying cause.
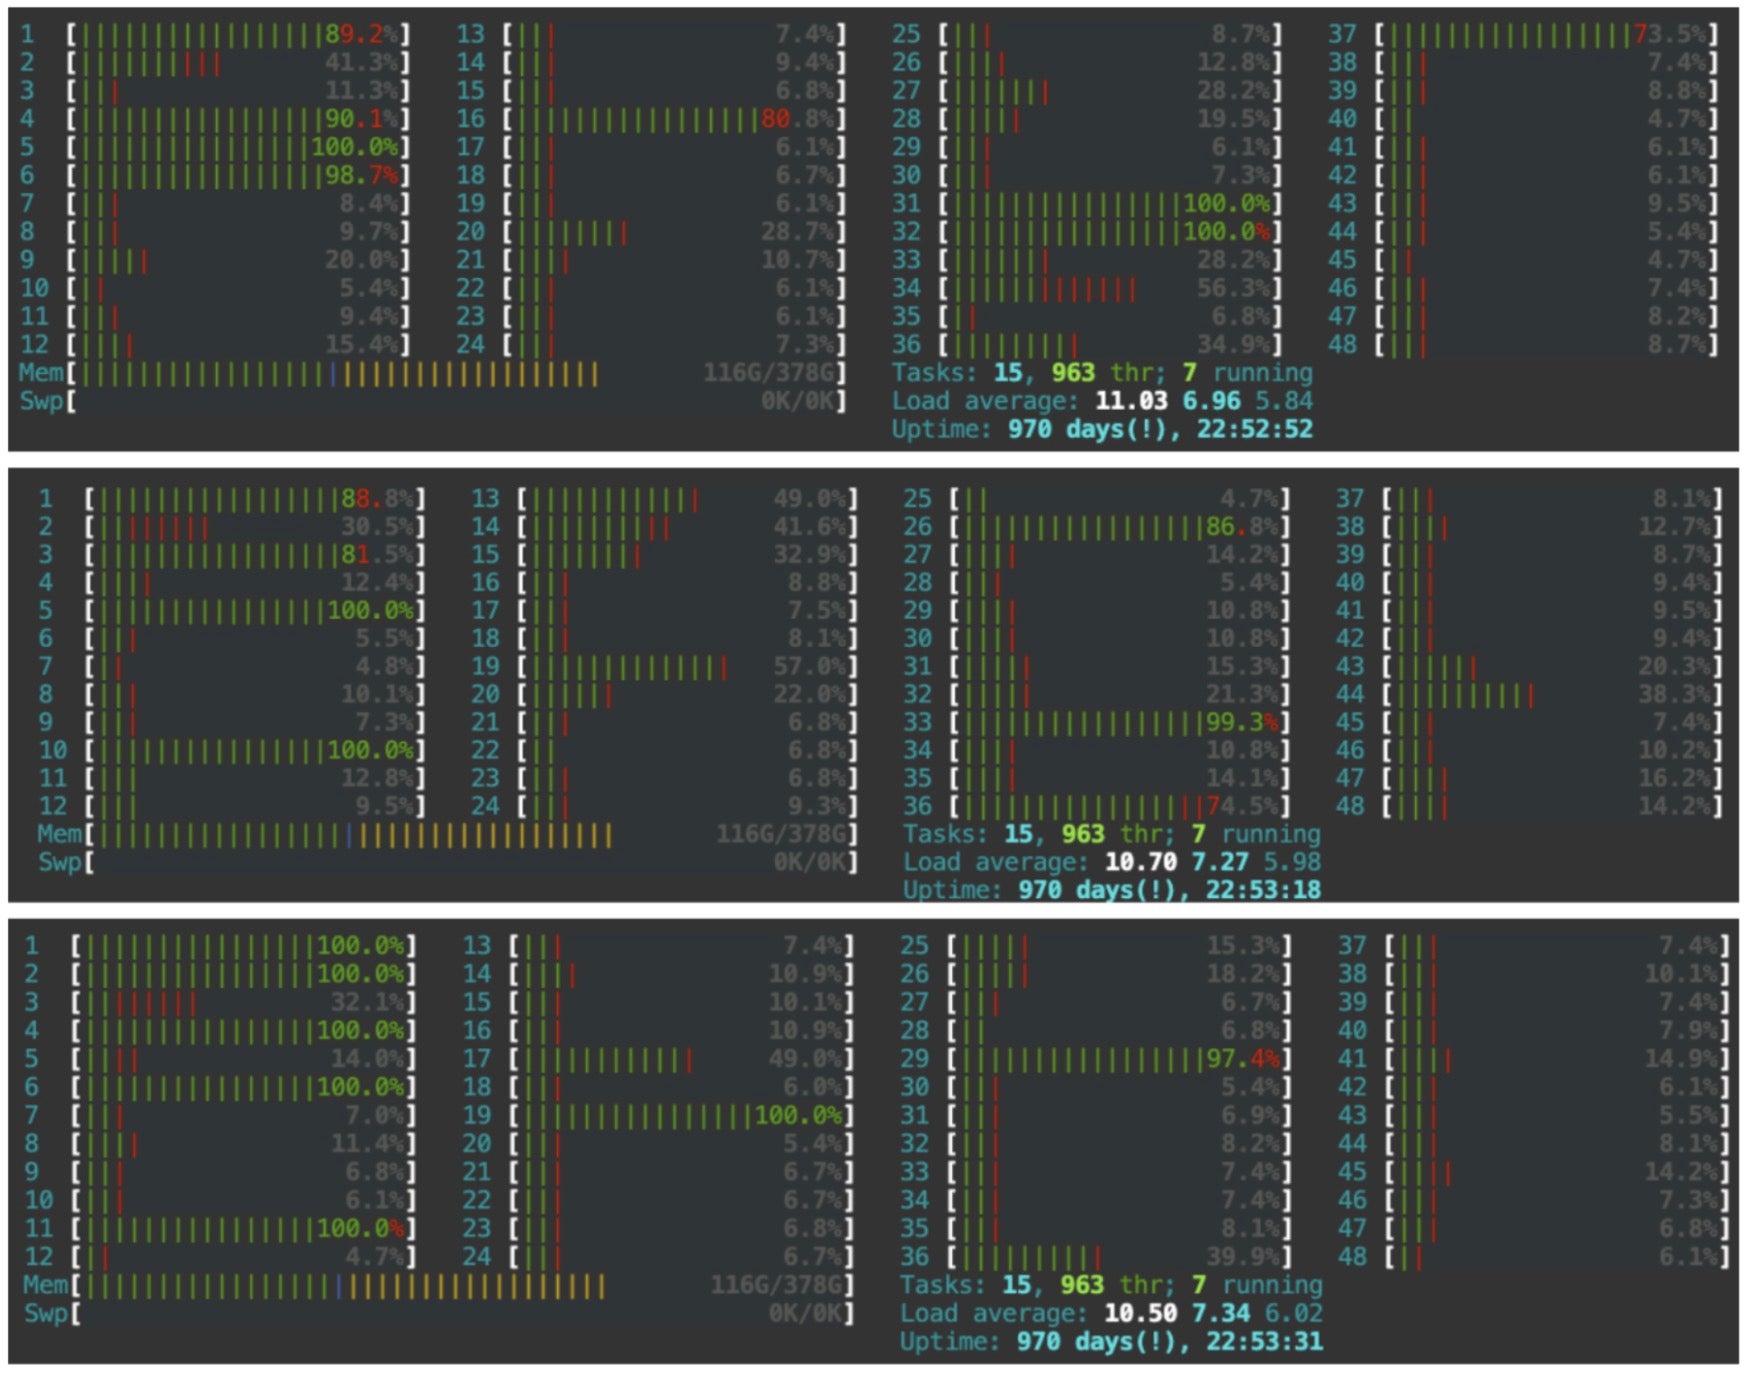
Even when the total thread count was adjusted to match the CPU(2nd Generation, Intel(R) Xeon(R) Silver 4214) limit(8 core), there were instances where computations were executed from logical thread to logical core. Due to the presence of 24 physical cores, the cores numbered 25 to 48 are classified as logical cores. The possibility of confining thread execution solely within physical cores seemed to offer the potential for further performance enhancement. The reference to this solution could be found within the source document mentioned in the PyTorch-geometric article that warned about CPU GEMM bottlenecks.
- Reference Documentation: Grokking Pytorch Intel CPU Performance From First Principles
As per the instructions in the document, Intel provides Intel® Extension for PyTorch where we can simply pin cores to specific sockets. The application method is also made very simple, by adding the following settings to the torchserve config.properties file.(used intel_extension_for_pytorch==1.13.0)
ipex_enable=true
CPU_launcher_enable=true
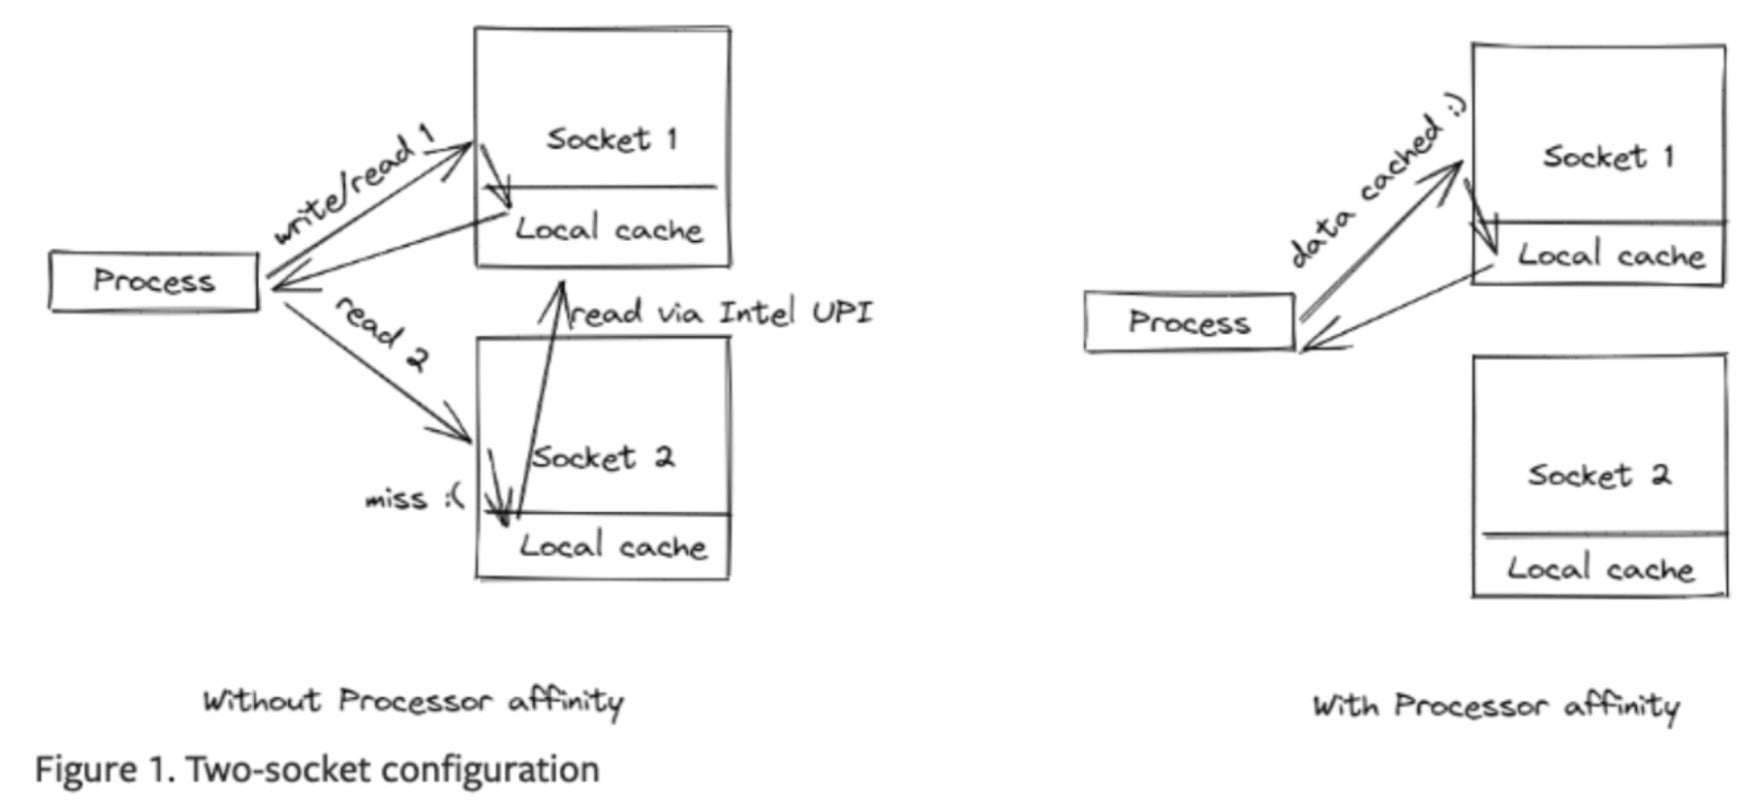
Image Source: PyTorch
Beyond the removal of logical threads through socket pinning, there is an additional effect of eliminating UPI cache hit overhead. Since the CPU comprises more than one socket when threads scheduled on socket 1 are rescheduled on socket 2, cache hits occur in cases of accessing the cache of socket 1 via Intel Ultra Path Interconnect (UPI). At this point, UPI access to the local cache becomes more than twice as slow as local cache access, resulting in more bottlenecks. With threads being pinned to socket units by oneAPI powered Intel® Extension for PyTorch, We observed rps handling increase of up to four times than when the bottleneck existed.
Type     Name                                                                          # reqs      # fails |    Avg     Min     Max    Med |   req/s  failures/s
--------|----------------------------------------------------------------------------|-------|-------------|-------|-------|-------|-------|--------|-----------
POST     /predictions/image-scoring                                                       131     0(0.00%) |   3456    1412    6813   3100 |    7.90        0.00
--------|----------------------------------------------------------------------------|-------|-------------|-------|-------|-------|-------|--------|-----------
         Aggregated                                                                       131     0(0.00%) |   3456    1412    6813   3100 |    7.90        0.00
Cautionary Note 1: Intel® Extension for PyTorch is specialized in neural network (referred to as “nn” hereafter) inference optimization, so the performance improvement from additional techniques outside nn might be minimal. Indeed, in the instance of the image scoring system highlighted as an example, where svr (support vector regression) is applied post-inference, the performance enhancement was confined to a 4-fold increase. However, for a purely nn inference model such as the food recognition model, a performance boost of 7-fold (2.5rps -> 17.5rps) was detected.
Type     Name                                                                          # reqs      # fails |    Avg     Min     Max    Med |   req/s  failures/s
--------|----------------------------------------------------------------------------|-------|-------------|-------|-------|-------|-------|--------|-----------
POST     /predictions/food-classification                                                 446     0(0.00%) |   1113     249    1804   1200 |   17.50        0.00
--------|----------------------------------------------------------------------------|-------|-------------|-------|-------|-------|-------|--------|-----------
         Aggregated                                                                       446     0(0.00%) |   1113     249    1804   1200 |   17.50        0.00
Cautionary Note 2: Applying Intel® Extension for PyTorch requires torchserve version 0.6.1 or higher. Since our team was using version 0.6.0, there was an issue where socket pinning was not functioning correctly. Currently, we have made modifications to the guide document, specifying the required version.
Within WorkerLifeCycle.java, multi-worker pinning is not supported in 0.6.0 and below (ninstance is hardcoded to 1)
// 0.6.0 version

public ArrayList<String> launcherArgsToList() {
   ArrayList<String> arrlist = new ArrayList<String>();
   arrlist.add("-m");
   arrlist.add("intel_extension_for_pytorch.cpu.launch");
   arrlist.add(" — ninstance");
   arrlist.add("1");
   if (launcherArgs != null && launcherArgs.length() > 1) {
     String[] argarray = launcherArgs.split(" ");
     for (int i = 0; i < argarray.length; i++) {
       arrlist.add(argarray[i]);
     }
   }
   return arrlist;
 }
// master version

if (this.numWorker > 1) {
   argl.add(" — ninstances");
   argl.add(String.valueOf(this.numWorker));
   argl.add(" — instance_idx");
   argl.add(String.valueOf(this.currNumRunningWorkers));
 }
2: Addressing Slow Latency Through Model Lightweighting
We also streamlined our model using Knowledge Distillation (commonly abbreviated as KD) to further reduce latency. As is widely known, kd is a technique where knowledge from a larger network (Teacher network) is conveyed to a smaller, lightweight network (Student network) which is less resource intensive and can be more readily deployed. For more detailed information, please refer to the paper where this concept was initially introduced, titled Distilling the Knowledge in a Neural Network.
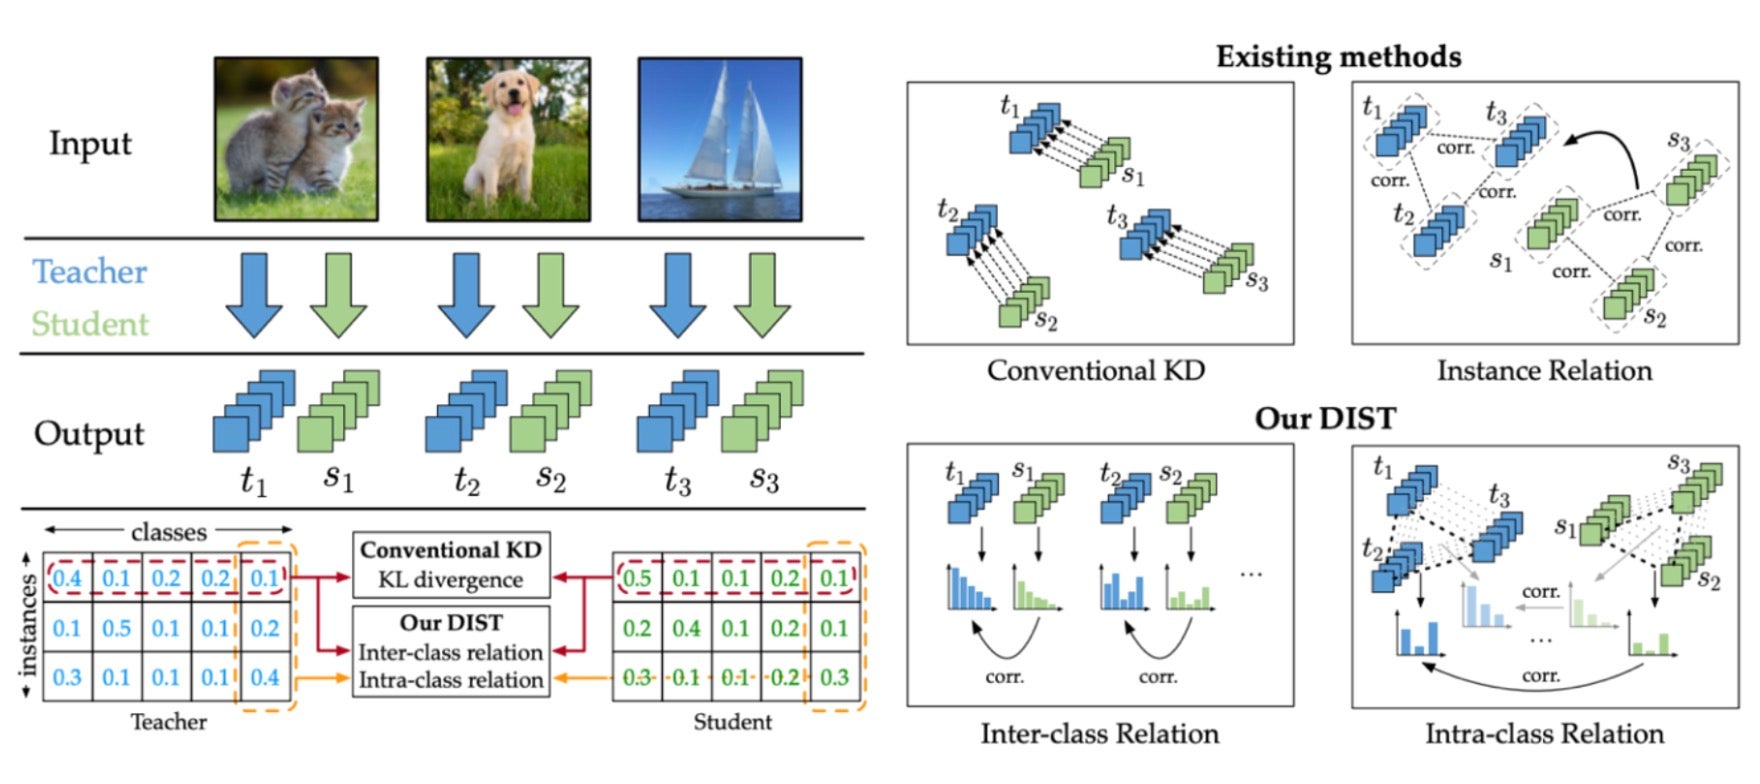
There is a variety of KD techniques available and because we were primarily focused on accuracy loss minimization, we adopted the approach from the paper Knowledge Distillation from A Stronger Teacher, which was published in the year 2022. The concept is straightforward. Unlike the conventional method of distillation that utilizes only the model’s prop values, the chosen approach involves having the student network learn the correlations between classes in the teacher network. When put into actual application, We observed effective model weight reduction to observe the effective reduction in the model’s weight while mainting high accuracy. The following are the outcomes of our experimentation with the mentioned knowledge distillation technique on several candidate student models, where selections were made based on the maintained level of accuracy.
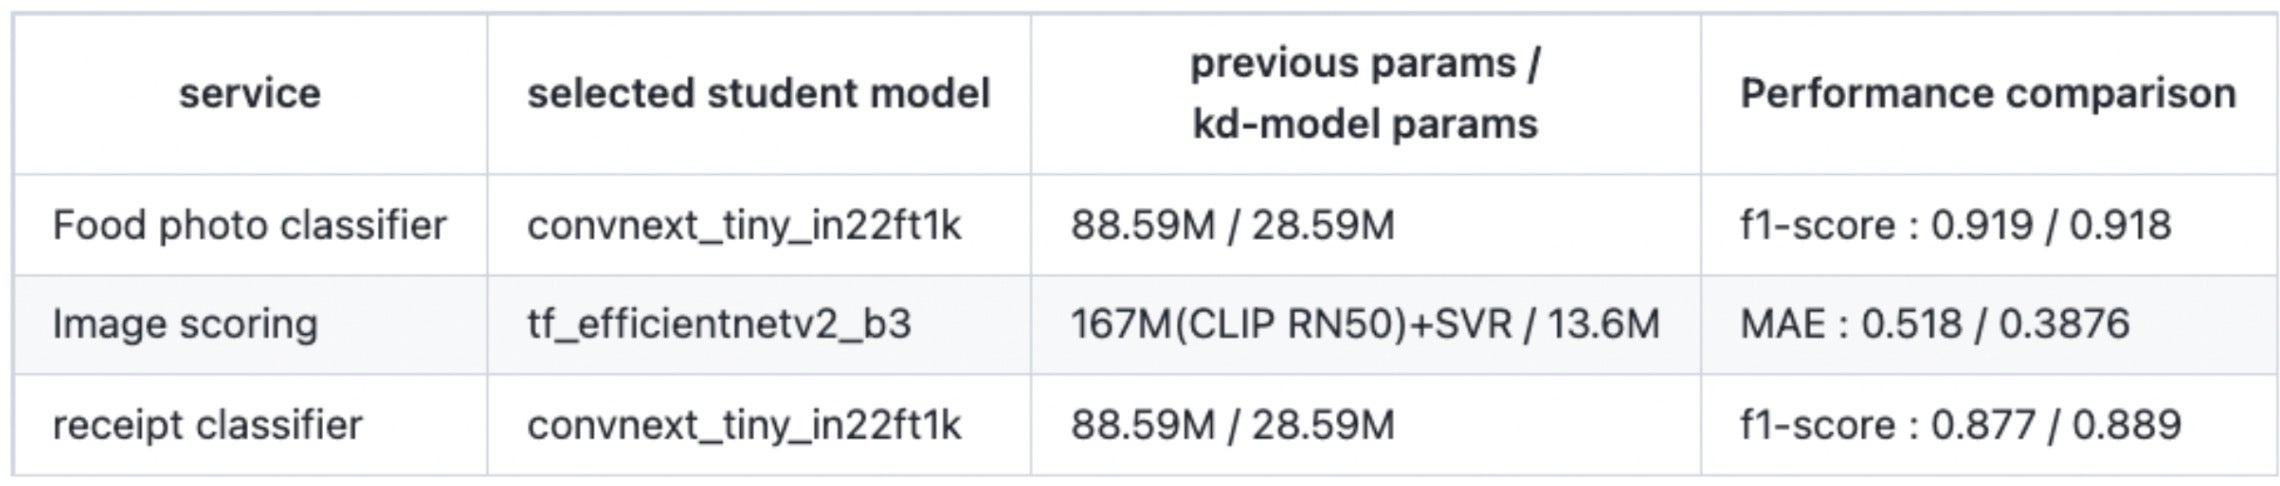
For the image scoring system, additional measures were taken to reduce the input size. Considering that the prior use of CPU-based ML technique SVR (Support Vector Regression) was used (2-stage: CNN + SVR), even when this was streamlined into a 1-stage model, significant speed advantages were not observed in CPU inference. In order for streamlining to have significance, the input size of the student model during inference needed further reduction. Consequently, experiments were conducted with the size reduced from 384384 to 224224.
Further simplifying transformations, the 2-stage (CNN + SVR) approach was unified into a 1-stage model with a larger ConvNext, and then kd was applied using the lightweight EfficientNet to resolve the accuracy trade-off. During the experiments, we encountered a problem where changing Img_resize to 224 led to a performance drop from 0.4007 to 0.4296 in terms of MAE. Due to the reduction in input size, various preprocessing techniques applied to the original training images (such as Affine, RandomRotate90, Blur, OneOf [GridDistortion, OpticalDistortion, ElasticTransform], VerticalFlip) had a counterproductive effect. By adopting these measures, effective training of the student was achieved, and the MAE value improved by 25% compared to the previous one (.518 to .3876).
Validation
1: Final Performance Measurement
The following shows the final performance improvements using CPU servers, on the three models mentioned throughout this article.
# Food photo classifier (pod 3): 2.5rps -> 84 rps

 Type Name                                                                           # reqs # fails | Avg Min Max Med | req/s failures/s
 --------|----------------------------------------------------------------------------|------|------------|-------|------|-------|-------|--------|---------
POST /predictions/food-classification 2341 0(0.00%) | 208 130 508 200 | 84.50 0.00
--------|----------------------------------------------------------------------------|--------|-------------|------|-------|--------|------|--------|----------
         Aggregated                                                                      2341     0(0.00%) |    208     130     508    200 |   84.50        0.00

# Image scoring (pod 3): 2.1rps -> 62rps
 Type Name                                                                               #reqs #fails | Avg Min Max Median | req/s failures/s
 --------|---------------------------------------------------------------------------------|--------|-------------|--------|-------|--------|---------|--------|---------
  POST /predictions/image-scoring 1298 0 (0.00%) | 323 99 607 370 | 61.90 0.00
--------|---------------------------------------------------------------------------------|--------|-------------|--------|------|--------|---------|--------|----------
          Aggregated                                                                          1298     0(0.00%)  |     323      99     607     370  |   61.90        0.00

# receipt classifier(pod 3) : 20rps -> 111.8rps
Type     Name                                                                          # reqs      # fails |    Avg     Min     Max    Med |   req/s  failures/s
--------|----------------------------------------------------------------------------|-------|-------------|-------|-------|-------|-------|--------|-----------
POST     /predictions/receipt-classification                                             4024     0(0.00%) |    266     133    2211    200 |   111.8        0.00
--------|----------------------------------------------------------------------------|-------|-------------|-------|-------|-------|-------|--------|-----------
         Aggregated                                                                      4020     0(0.00%) |    266     133    2211    200 |   111.8        0.00
2: Traffic Mirroring
As previously mentioned, our team’s service architecture employs the tool “traefik” as a gateway in front of the app server, as briefly introduced at the beginning of the article. For final validation, the mirroring feature of this traefik gateway was utilized to mirror traffic from production to staging for a month of validation before applying it to production, which is now operational.
Details regarding mirroring are beyond the scope of this topic and hence omitted. For those interested, kindly refer to the document at https://doc.traefik.io/traefik/routing/services/#mirroring-service.
In Conclusion
This concludes the discussion about transitioning from a GPU model server to a CPU server while maintaining service quality. Through this effort, our team was able to save 15 GPUs each in South Korea and Japan, resulting in an annual cost savings of approximately 340 thousand U.S. Dollar. Although we directly purchase and use GPUs within NAVER, we calculated a rough cost reduction based on AWS EC2 instances that stably support T4 GPUs.
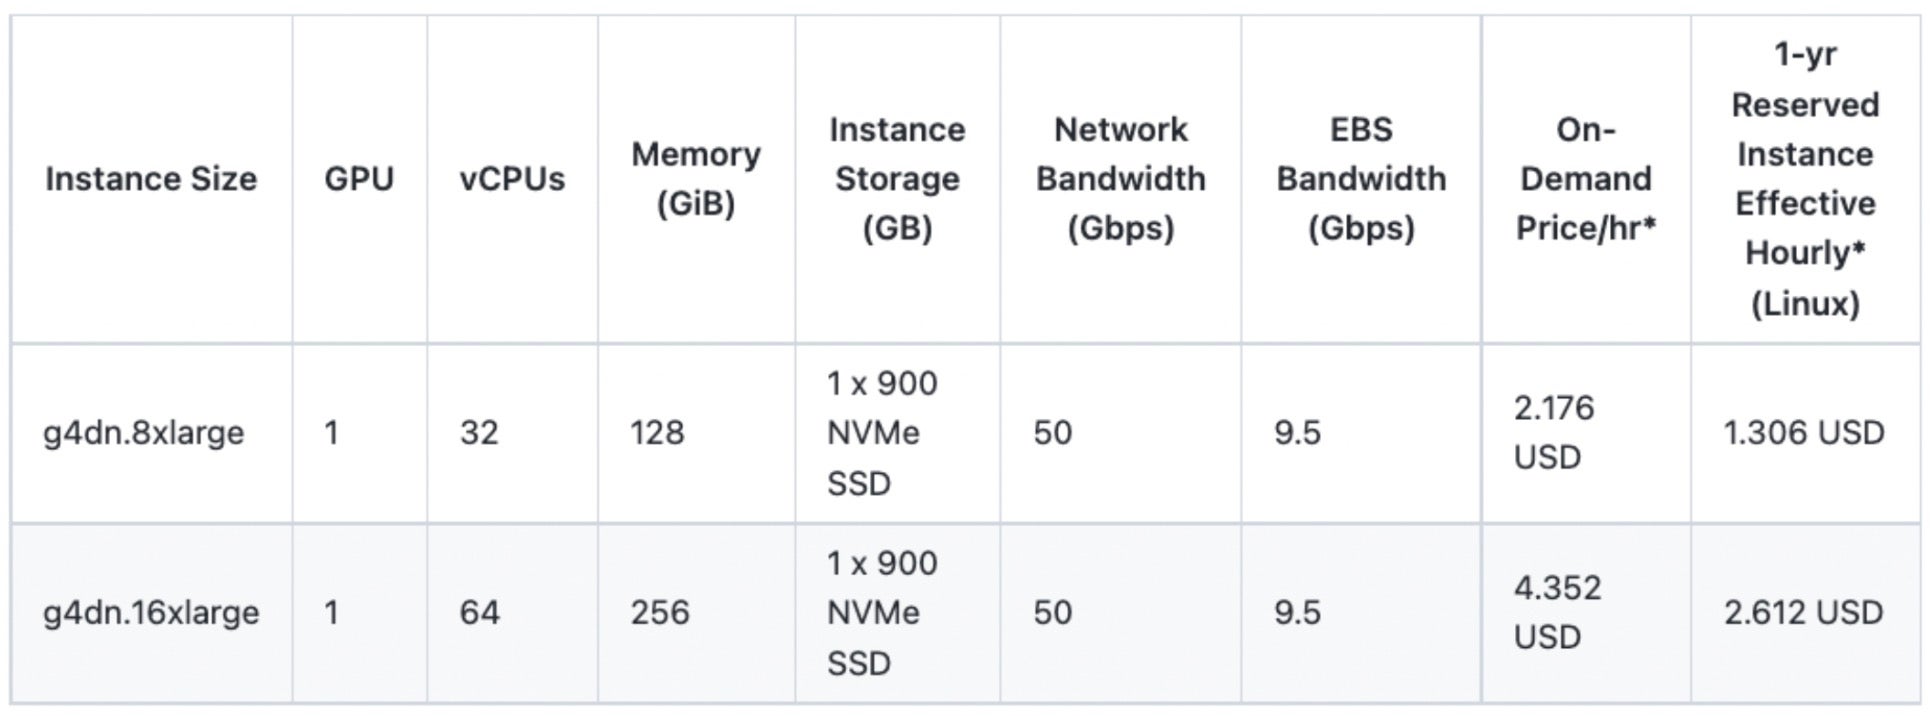
Calculation: 1.306 (1-year reserved instance effective hourly cost) * 24 (hours) * 365 (days) * 15 (number of GPUs) * 2 (KR + JP)
These secured GPUs will be harnessed to further advance and enhance our team’s AI services, delivering exceptional service experiences. We sincerely appreciate your encouragement and anticipation.:)
Explore More
- https://www.intel.com/content/www/us/en/developer/ecosystem/pytorch-foundation.html
- https://pytorch-geometric.readthedocs.io/en/latest/advanced/CPU_affinity.html#binding-processes-to-physical-cores
- https://arxiv.org/pdf/2205.10536.pdf