TorchGeo is a PyTorch domain library providing datasets, samplers, transforms, and pre-trained models specific to geospatial data.
https://github.com/microsoft/torchgeo
For decades, Earth observation satellites, aircraft, and more recently UAV platforms have been collecting increasing amounts of imagery of the Earth’s surface. With information about seasonal and long-term trends, remotely sensed imagery can be invaluable for solving some of the greatest challenges to humanity, including climate change adaptation, natural disaster monitoring, water resource management, and food security for a growing global population. From a computer vision perspective, this includes applications like land cover mapping (semantic segmentation), deforestation and flood monitoring (change detection), glacial flow (pixel tracking), hurricane tracking and intensity estimation (regression), and building and road detection (object detection, instance segmentation). By leveraging recent advancements in deep learning architectures, cheaper and more powerful GPUs, and petabytes of freely available satellite imagery datasets, we can come closer to solving these important problems.
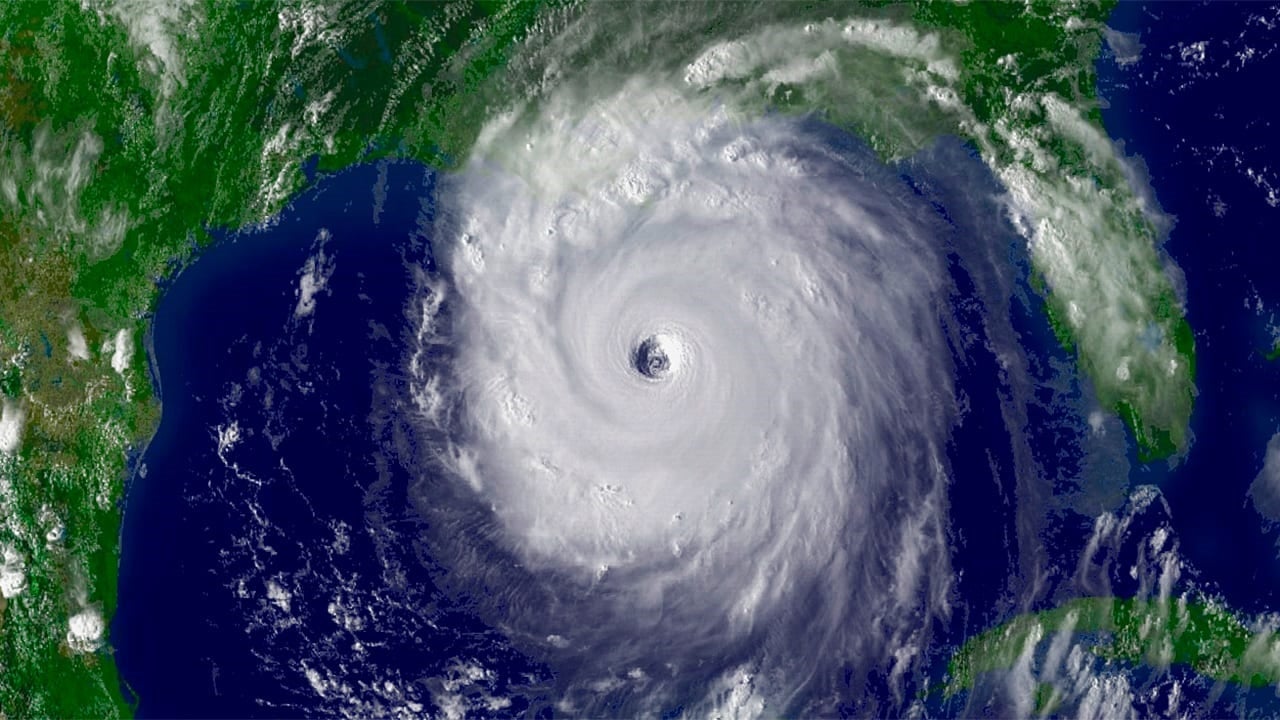
National Oceanic and Atmospheric Administration satellite image of Hurricane Katrina, taken on August 28, 2005 (source). Geospatial machine learning libraries like TorchGeo can be used to detect, track, and predict future trajectories of hurricanes and other natural disasters.
The challenges
In traditional computer vision datasets, such as ImageNet, the image files themselves tend to be rather simple and easy to work with. Most images have 3 spectral bands (RGB), are stored in common file formats like PNG or JPEG, and can be easily loaded with popular software libraries like PIL or OpenCV. Each image in these datasets is usually small enough to pass directly into a neural network. Furthermore, most of these datasets contain a finite number of well-curated images that are assumed to be independent and identically distributed, making train-val-test splits straightforward. As a result of this relative homogeneity, the same pre-trained models (e.g., CNNs pretrained on ImageNet) have shown to be effective across a wide range of vision tasks using transfer learning methods. Existing libraries, such as torchvision, handle these simple cases well, and have been used to make large advances in vision tasks over the past decade.
Remote sensing imagery is not so uniform. Instead of simple RGB images, satellites tend to capture images that are multispectral (Landsat 8 has 11 spectral bands) or even hyperspectral (Hyperion has 242 spectral bands). These images capture information at a wider range of wavelengths (400 nm–15 µm), far outside of the visible spectrum. Different satellites also have very different spatial resolutions—GOES has a resolution of 4 km/px, Maxar imagery is 30 cm/px, and drone imagery resolution can be as high as 7 mm/px. These datasets almost always have a temporal component, with satellite revisists that are daily, weekly, or biweekly. Images often have overlap with other images in the dataset, and need to be stitched together based on geographic metadata. These images tend to be very large (e.g., 10K x 10K pixels), so it isn’t possible to pass an entire image through a neural network. This data is distributed in hundreds of different raster and vector file formats like GeoTIFF and ESRI Shapefile, requiring specialty libraries like GDAL to load.
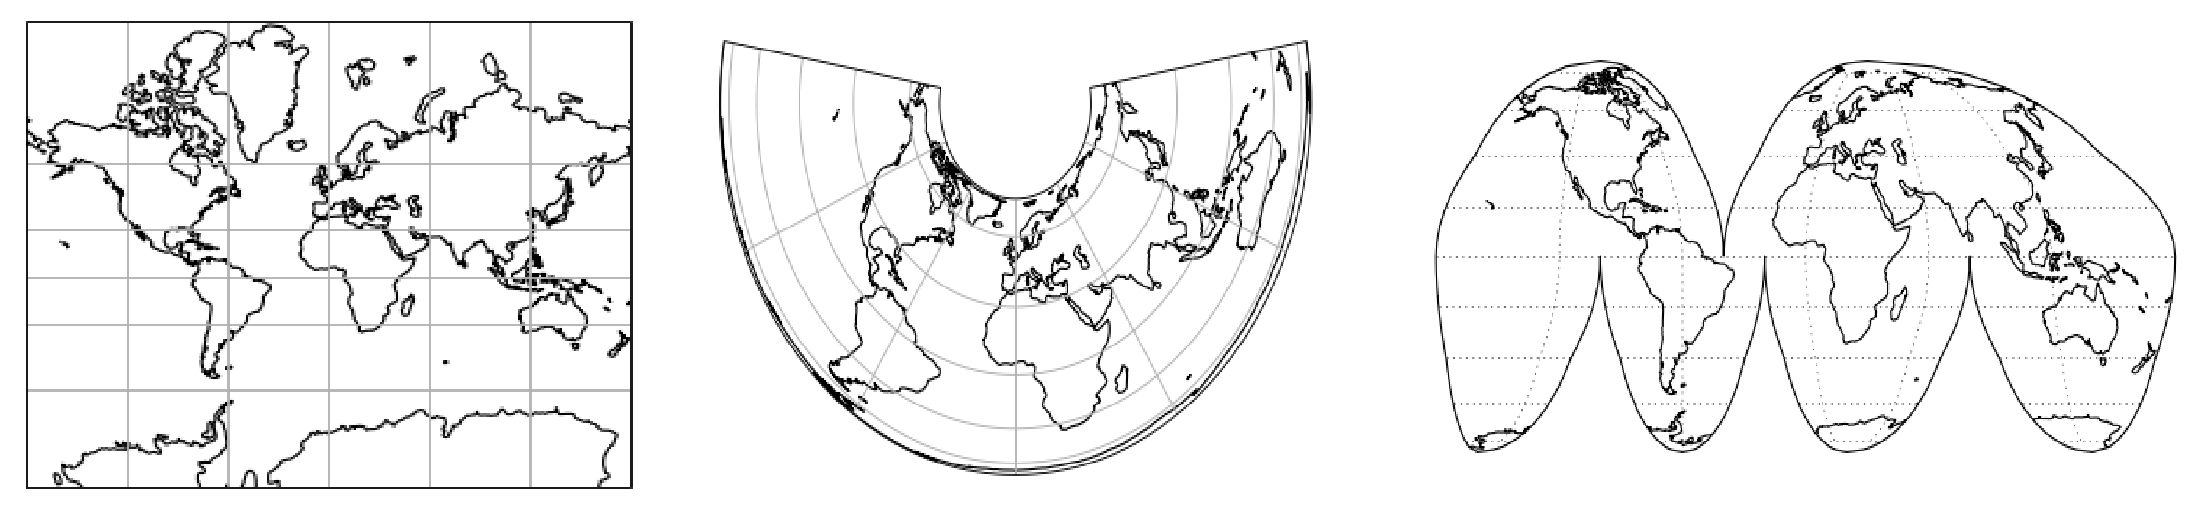
From left to right: Mercator, Albers Equal Area, and Interrupted Goode Homolosine projections (source). Geospatial data is associated with one of many different types of reference systems that project the 3D Earth onto a 2D representation. Combining data from different sources often involves re-projecting to a common reference system in order to ensure that all layers are aligned.
Although each image is 2D, the Earth itself is 3D. In order to stitch together images, they first need to be projected onto a 2D representation of the Earth, called a coordinate reference system (CRS). Most people are familiar with equal angle representations like Mercator that distort the size of regions (Greenland looks larger than Africa even though Africa is 15x larger), but there are many other CRSs that are commonly used. Each dataset may use a different CRS, and each image within a single dataset may also be in a unique CRS. In order to use data from multiple layers, they must all share a common CRS, otherwise the data won’t be properly aligned. For those who aren’t familiar with remote sensing data, this can be a daunting task.
Even if you correctly georeference images during indexing, if you don’t project them to a common CRS, you’ll end up with rotated images with nodata values around them, and the images won’t be pixel-aligned.
The solution
At the moment, it can be quite challenging to work with both deep learning models and geospatial data without having expertise in both of these very different fields. To address these challenges, we’ve built TorchGeo, a PyTorch domain library for working with geospatial data. TorchGeo is designed to make it simple:
- for machine learning experts to work with geospatial data, and
- for remote sensing experts to explore machine learning solutions.
TorchGeo is not just a research project, but a production-quality library that uses continuous integration to test every commit with a range of Python versions on a range of platforms (Linux, macOS, Windows). It can be easily installed with any of your favorite package managers, including pip, conda, and spack:
$ pip install torchgeo
TorchGeo is designed to have the same API as other PyTorch domain libraries like torchvision, torchtext, and torchaudio. If you already use torchvision in your workflow for computer vision datasets, you can switch to TorchGeo by changing only a few lines of code. All TorchGeo datasets and samplers are compatible with the PyTorch DataLoader class, meaning that you can take advantage of wrapper libraries like PyTorch Lightning for distributed training. In the following sections, we’ll explore possible use cases for TorchGeo to show how simple it is to use.
Geospatial datasets and samplers
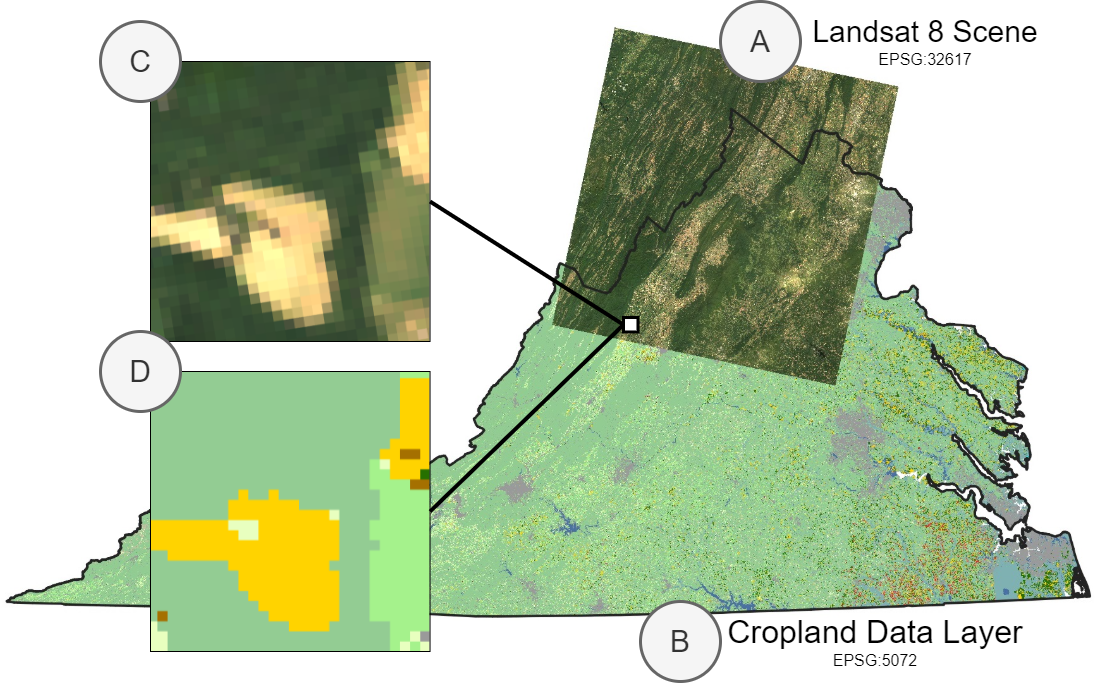
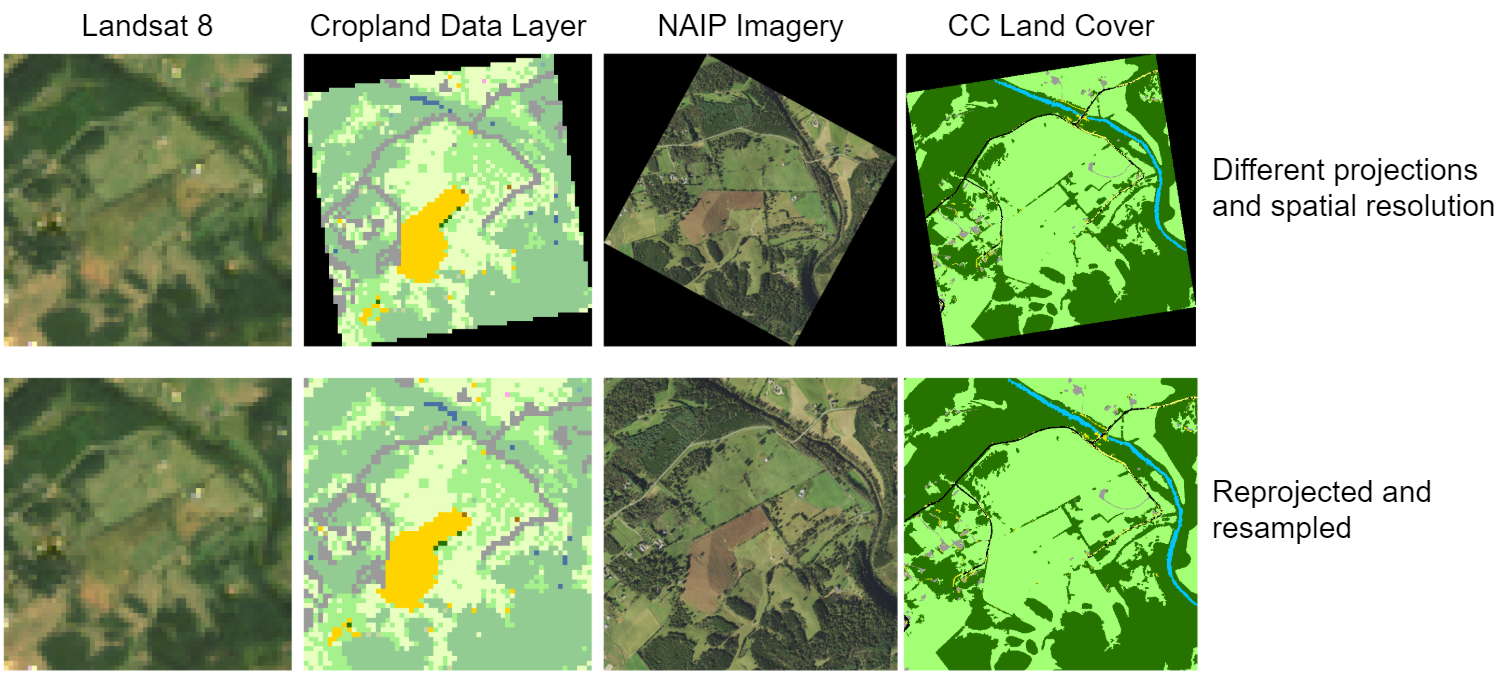
Example application in which we combine A) a scene from Landsat 8 and B) Cropland Data Layer labels, even though these files are in different EPSG projections. We want to sample patches C) and D) from these datasets using a geospatial bounding box as an index.
Many remote sensing applications involve working with geospatial datasets —datasets with geographic metadata. In TorchGeo, we define a GeoDataset class to represent these kinds of datasets. Instead of being indexed by an integer, each GeoDataset is indexed by a spatiotemporal bounding box, meaning that two or more datasets covering a different geographic extent can be intelligently combined.
In this example, we show how easy it is to work with geospatial data and to sample small image patches from a combination of Landsat and Cropland Data Layer (CDL) data using TorchGeo. First, we assume that the user has Landsat 7 and 8 imagery downloaded. Since Landsat 8 has more spectral bands than Landsat 7, we’ll only use the bands that both satellites have in common. We’ll create a single dataset including all images from both Landsat 7 and 8 data by taking the union between these two datasets.
from torch.utils.data import DataLoader
from torchgeo.datasets import CDL, Landsat7, Landsat8, stack_samples
from torchgeo.samplers import RandomGeoSampler

landsat7 = Landsat7(root="...")
landsat8 = Landsat8(root="...", bands=Landsat8.all_bands[1:-2])
landsat = landsat7 | landsat8
Next, we take the intersection between this dataset and the CDL dataset. We want to take the intersection instead of the union to ensure that we only sample from regions where we have both Landsat and CDL data. Note that we can automatically download and checksum CDL data. Also note that each of these datasets may contain files in different CRSs or resolutions, but TorchGeo automatically ensures that a matching CRS and resolution is used.
cdl = CDL(root="...", download=True, checksum=True)
dataset = landsat & cdl
This dataset can now be used with a PyTorch data loader. Unlike benchmark datasets, geospatial datasets often include very large images. For example, the CDL dataset consists of a single image covering the entire contiguous United States. In order to sample from these datasets using geospatial coordinates, TorchGeo defines a number of samplers. In this example, we’ll use a random sampler that returns 256 x 256 pixel images and 10,000 samples per epoch. We’ll also use a custom collation function to combine each sample dictionary into a mini-batch of samples.
sampler = RandomGeoSampler(dataset, size=256, length=10000)
dataloader = DataLoader(dataset, batch_size=128, sampler=sampler, collate_fn=stack_samples)
This data loader can now be used in your normal training/evaluation pipeline.
for batch in dataloader:
    image = batch["image"]
    mask = batch["mask"]

    # train a model, or make predictions using a pre-trained model
Many applications involve intelligently composing datasets based on geospatial metadata like this. For example, users may want to:
- Combine datasets for multiple image sources and treat them as equivalent (e.g., Landsat 7 and 8)
- Combine datasets for disparate geospatial locations (e.g., Chesapeake NY and PA)
These combinations require that all queries are present in at least one dataset, and can be created using a UnionDataset. Similarly, users may want to:
- Combine image and target labels and sample from both simultaneously (e.g., Landsat and CDL)
- Combine datasets for multiple image sources for multimodal learning or data fusion (e.g., Landsat and Sentinel)
These combinations require that all queries are present in both datasets, and can be created using an IntersectionDataset. TorchGeo automatically composes these datasets for you when you use the intersection (&) and union (|) operators.
Multispectral and geospatial transforms
In deep learning, it’s common to augment and transform the data so that models are robust to variations in the input space. Geospatial data can have variations such as seasonal changes and warping effects, as well as image processing and capture issues like cloud cover and atmospheric distortion. TorchGeo utilizes augmentations and transforms from the Kornia library, which supports GPU acceleration and supports multispectral imagery with more than 3 channels.
Traditional geospatial analyses compute and visualize spectral indices which are combinations of multispectral bands. Spectral indices are designed to highlight areas of interest in a multispectral image relevant to some application, such as vegetation health, areas of man-made change or increasing urbanization, or snow cover. TorchGeo supports numerous transforms, which can compute common spectral indices and append them as additional bands to a multispectral image tensor.
Below, we show a simple example where we compute the Normalized Difference Vegetation Index (NDVI) on a Sentinel-2 image. NDVI measures the presence of vegetation and vegetation health and is computed as the normalized difference between the red and near-infrared (NIR) spectral bands. Spectral index transforms operate on sample dictionaries returned from TorchGeo datasets and append the resulting spectral index to the image channel dimension.
First, we instantiate a Sentinel-2 dataset and load a sample image. Then, we plot the true color (RGB) representation of this data to see the region we are looking at.
import matplotlib.pyplot as plt
from torchgeo.datasets import Sentinel2
from torchgeo.transforms import AppendNDVI

dataset = Sentinel2(root="...")
sample = dataset[...]
fig = dataset.plot(sample)
plt.show()
Next, we instantiate and compute an NDVI transform, appending this new channel to the end of the image. Sentinel-2 imagery uses index 0 for its red band and index 3 for its NIR band. In order to visualize the data, we also normalize the image. NDVI values can range from -1 to 1, but we want to use the range 0 to 1 for plotting.
transform = AppendNDVI(index_red=0, index_nir=3)
sample = transform(sample)
sample["image"][-1] = (sample["image"][-1] + 1) / 2
plt.imshow(sample["image"][-1], cmap="RdYlGn_r")
plt.show()
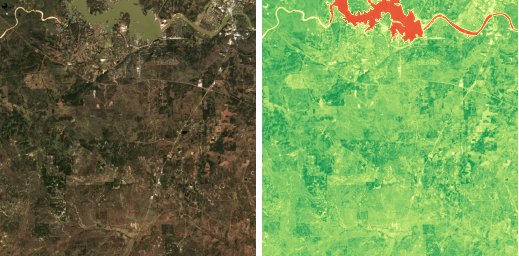
True color (left) and NDVI (right) of the Texas Hill Region, taken on November 16, 2018 by the Sentinel-2 satellite. In the NDVI image, red indicates water bodies, yellow indicates barren soil, light green indicates unhealthy vegetation, and dark green indicates healthy vegetation.
Benchmark datasets
One of the driving factors behind progress in computer vision is the existence of standardized benchmark datasets like ImageNet and MNIST. Using these datasets, researchers can directly compare the performance of different models and training procedures to determine which perform the best. In the remote sensing domain, there are many such datasets, but due to the aforementioned difficulties of working with this data and the lack of existing libraries for loading these datasets, many researchers opt to use their own custom datasets.
One of the goals of TorchGeo is to provide easy-to-use data loaders for these existing datasets. TorchGeo includes a number of benchmark datasets —datasets that include both input images and target labels. This includes datasets for tasks like image classification, regression, semantic segmentation, object detection, instance segmentation, change detection, and more.
If you’ve used torchvision before, these types of datasets should be familiar. In this example, we’ll create a dataset for the Northwestern Polytechnical University (NWPU) very-high-resolution ten-class (VHR-10) geospatial object detection dataset. This dataset can be automatically downloaded, checksummed, and extracted, just like with torchvision.
from torch.utils.data import DataLoader
from torchgeo.datasets import VHR10

dataset = VHR10(root="...", download=True, checksum=True)
dataloader = DataLoader(dataset, batch_size=128, shuffle=True, num_workers=4)

for batch in dataloader:
    image = batch["image"]
    label = batch["label"]

    # train a model, or make predictions using a pre-trained model
All TorchGeo datasets are compatible with PyTorch data loaders, making them easy to integrate into existing training workflows. The only difference between a benchmark dataset in TorchGeo and a similar dataset in torchvision is that each dataset returns a dictionary with keys for each PyTorch Tensor.
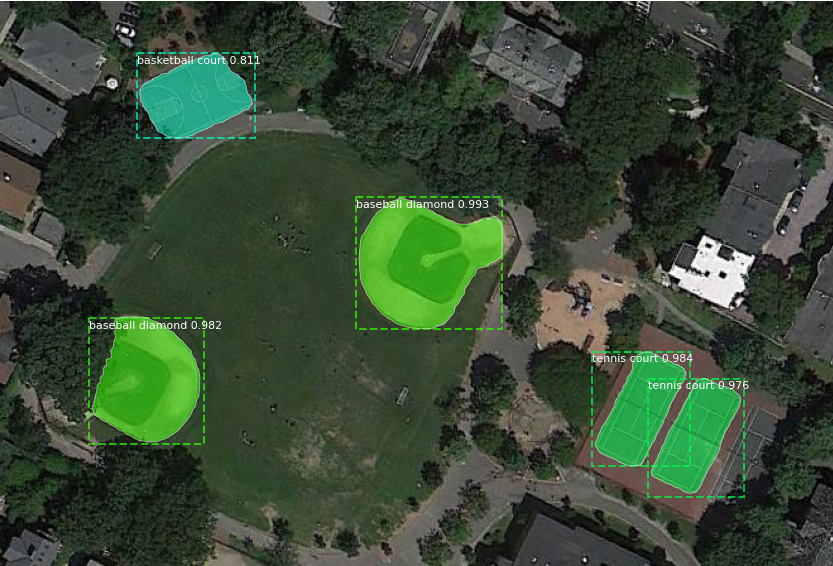
Example predictions from a Mask R-CNN model trained on the NWPU VHR-10 dataset. The model predicts sharp bounding boxes and masks for all objects with high confidence scores.
Reproducibility with PyTorch Lightning
Another key goal of TorchGeo is reproducibility. For many of these benchmark datasets, there is no predefined train-val-test split, or the predefined split has issues with class imbalance or geographic distribution. As a result, the performance metrics reported in the literature either can’t be reproduced, or aren’t indicative of how well a pre-trained model would work in a different geographic location.
In order to facilitate direct comparisons between results published in the literature and further reduce the boilerplate code needed to run experiments with datasets in TorchGeo, we have created PyTorch Lightning datamodules with well-defined train-val-test splits and trainers for various tasks like classification, regression, and semantic segmentation. These datamodules show how to incorporate augmentations from the kornia library, include preprocessing transforms (with pre-calculated channel statistics), and let users easily experiment with hyperparameters related to the data itself (as opposed to the modeling process). Training a semantic segmentation model on the Inria Aerial Image Labeling dataset is as easy as a few imports and four lines of code.
from pytorch_lightning import Trainer
from torchgeo.datamodules import InriaAerialImageLabelingDataModule
from torchgeo.trainers import SemanticSegmentationTask

datamodule = InriaAerialImageLabelingDataModule(root_dir="...", batch_size=64, num_workers=6)
task = SemanticSegmentationTask(segmentation_model="unet", encoder_weights="imagenet", learning_rate=0.1)
trainer = Trainer(gpus=1, default_root_dir="...")

trainer.fit(model=task, datamodule=datamodule)
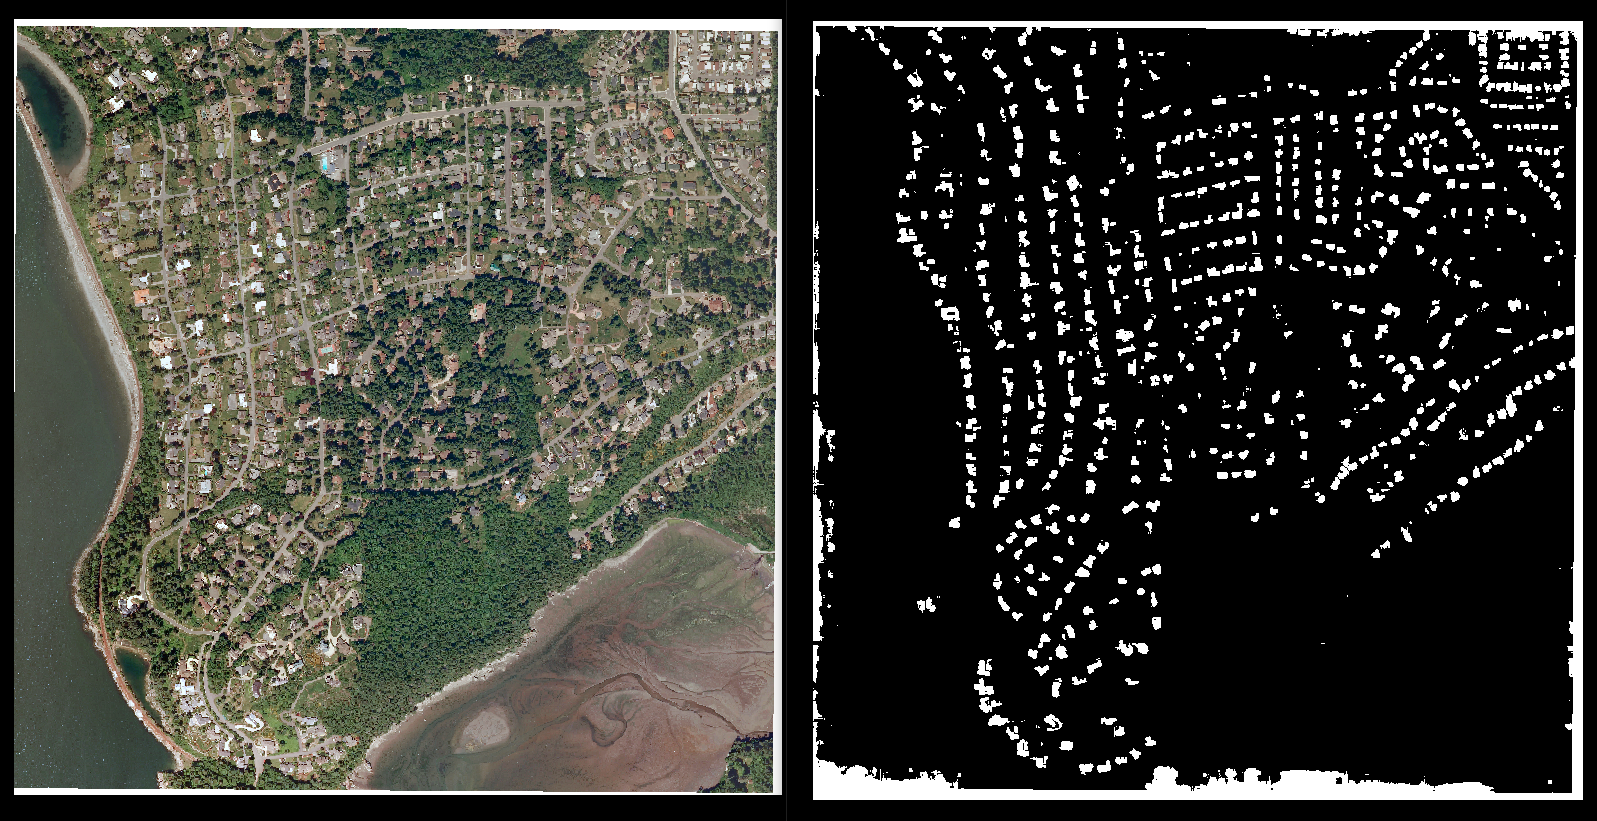
Building segmentations produced by a U-Net model trained on the Inria Aerial Image Labeling dataset. Reproducing these results is as simple as a few imports and four lines of code, making comparison of different models and training techniques simple and easy.
In our preprint we show a set of results that use the aforementioned datamodules and trainers to benchmark simple modeling approaches for several of the datasets in TorchGeo. For example, we find that a simple ResNet-50 can achieve state-of-the-art performance on the So2Sat dataset. These types of baseline results are important for evaluating the contribution of different modeling choices when tackling problems with remotely sensed data.
Future work and contributing
There is still a lot of remaining work to be done in order to make TorchGeo as easy to use as possible, especially for users without prior deep learning experience. One of the ways in which we plan to achieve this is by expanding our tutorials to include subjects like “writing a custom dataset” and “transfer learning”, or tasks like “land cover mapping” and “object detection”.
Another important project we are working on is pre-training models. Most remote sensing researchers work with very small labeled datasets, and could benefit from pre-trained models and transfer learning approaches. TorchGeo is the first deep learning library to provide models pre-trained on multispectral imagery. Our goal is to provide models for different image modalities (optical, SAR, multispectral) and specific platforms (Landsat, Sentinel, MODIS) as well as benchmark results showing their performance with different amounts of training data. Self-supervised learning is a promising method for training such models. Satellite imagery datasets often contain petabytes of imagery, but accurately labeled datasets are much harder to come by. Self-supervised learning methods will allow us to train directly on the raw imagery without needing large labeled datasets.
Aside from these larger projects, we’re always looking to add new datasets, data augmentation transforms, and sampling strategies. If you’re Python savvy and interested in contributing to TorchGeo, we would love to see contributions! TorchGeo is open source under an MIT license, so you can use it in almost any project.
External links:
- Homepage: https://github.com/microsoft/torchgeo
- Documentation: https://torchgeo.readthedocs.io/
- PyPI: https://pypi.org/project/torchgeo/
- Paper: https://arxiv.org/abs/2111.08872
If you like TorchGeo, give us a star on GitHub! And if you use TorchGeo in your work, please cite our paper.
Acknowledgments
We would like to thank all TorchGeo contributors for their efforts in creating the library, the Microsoft AI for Good program for support, and the PyTorch Team for their guidance. This research is part of the Blue Waters sustained-petascale computing project, which is supported by the National Science Foundation (awards OCI-0725070 and ACI-1238993), the State of Illinois, and as of December, 2019, the National Geospatial-Intelligence Agency. Blue Waters is a joint effort of the University of Illinois at Urbana-Champaign and its National Center for Supercomputing Applications. The research was supported in part by NSF grants IIS-1908104, OAC-1934634, and DBI-2021898.