If you’ve ever trained a large AI model and had it fail with an error like:
[Rank 0] Watchdog caught collective operation timeout: WorkNCCL(SeqNum=12345,
OpType=ALLREDUCE, NumelIn=1, NumelOut=1, Timeout(ms)=600000) ran for 600029
milliseconds before timing out.
Exception raised from checkTimeout at .../torch/csrc/distributed/c10d/ProcessGroupNCCL.cpp:692 (most recent call
first):

...

# 2  c10d::ProcessGroupNCCL::WorkNCCL::checkTimeout(std::optional<std::chrono::duration<long, std::ratio<1l, 1000l> > >)
# 3  c10d::ProcessGroupNCCL::Watchdog::runLoop()
# 4  c10d::ProcessGroupNCCL::Watchdog::run()
# 5  execute_native_thread_routine
# 6  start_thread
# 7  __clone3
You’ve encountered the infamous NCCL watchdog timeout. Debugging this error can be hard – the error message is generic, debugging requires cross-rank telemetry analysis, and root causes are multi-layered and can have a complex causal chain.
This post provides key insights on NCCL watchdog timeouts, including:
- Why this error happens and why it’s so hard to debug;
- A deep dive into the most common root causes for the error (e.g., CPU-side divergence, GPU hang, misconfigured collectives);
- How to use PyTorch Flight Recorder to quickly pinpoint what went wrong and how to fix it, including insights about how it is used within Meta.
By the end of this post, you should be equipped with the knowledge and practical tools needed to diagnose and resolve NCCL watchdog timeouts efficiently and with greater confidence.
Intro: What are collectives in PyTorch?
Let’s begin by examining how PyTorch functions in a distributed setting.
In the era of single-rank (i.e., single-GPU) training, when a user calls a tensor operation, such as torch.matmul(tensor1, tensor2), the request goes through the C++ dispatcher and eventually invokes backend kernels (e.g., CUDA kernels for GPU or C++ implementation for CPU). However, in distributed training users must perform synchronization after certain tensor operations to either avoid straggling or share computational results across ranks. For instance, a user might call dist.all_reduce(tensor1), which sums up all instances of tensor1 across the distributed setup and assigns the result back to tensor1. This type of synchronization is referred to as a “collective” operation. Collectives are executed in a “process group”, which represents a cohort of ranks that require synchronization. Examples of collectives include all-reduce (used in DDP), all-gather/reduce-scatter (used in FSDP), and all-to-all (used in TorchRec).
Now, let’s take a closer look at what happens when a user calls dist.all_reduce(tensor1). The call passes through both the C++ PyTorch dispatcher and a PyBind layer, where the latter ultimately calls into the PyTorch c10d layer. Within the c10d layer, PyTorch then invokes the collective communication APIs from various communication backend libraries, such as NCCL APIs for GPU communication and Gloo for CPU communication. The remainder of this discussion will primarily focus on this c10d layer.
A subsequent question can be: Why does PyTorch need this c10d layer? Why not let users call into the NCCL API directly? The answer is that PyTorch needs more control information before handing the request over to the communication library. The c10d layer provides a couple of features; in the context of this post, we focus on the most notable one: the PyTorch c10d watchdog. Since most modern training occurs on GPUs, we further narrow our discussion here to NCCL only and refer to this watchdog below as the NCCL watchdog, but note that while NCCL is specific to Nvidia GPUs, the c10d watchdog mechanism is capable of monitoring any distributed backend.
Problem statement: The NCCL watchdog timeout error
What is the NCCL watchdog timeout?
In an ideal scenario with no bugs or failures in collective usage, collectives are scheduled on the CPU side, executed asynchronously on the GPU, and the result is returned for subsequent use. However, the NCCL API itself does not provide any built-in error checking. If a collective is “misused” (including calling with invalid arguments, calling different collective across ranks, etc.), the collective execution will hang indefinitely on the GPU.
To detect this hang, PyTorch introduces a CPU-side Work object and a NCCL watchdog monitoring thread on the c10d layer. The Work object tracks the collective’s lifecycle on the GPU by wrapping the NCCL API calls with two CudaEvents before and after. This mechanism enables the PyTorch NCCL watchdog to periodically poll the status of a collective and check if it is completed on the GPU within a user-defined timeout (default is 10 minutes). If the timeout is exceeded, the NCCL watchdog throws an exception to interrupt the training process – this exception is the well-known “NCCL watchdog timeout” error, also commonly referred to as the “NCCL watchdog timeout” error. (Note that this abbreviation often causes confusion, as the “NCCL watchdog timeout” is not raised from the NCCL library but from the PyTorch NCCL watchdog. The error name contains “NCCL” because the timeout occurs while the collective is launched with the NCCL backend.)
Figure 1 below shows the sequence of events that triggers a NCCL watchdog timeout:
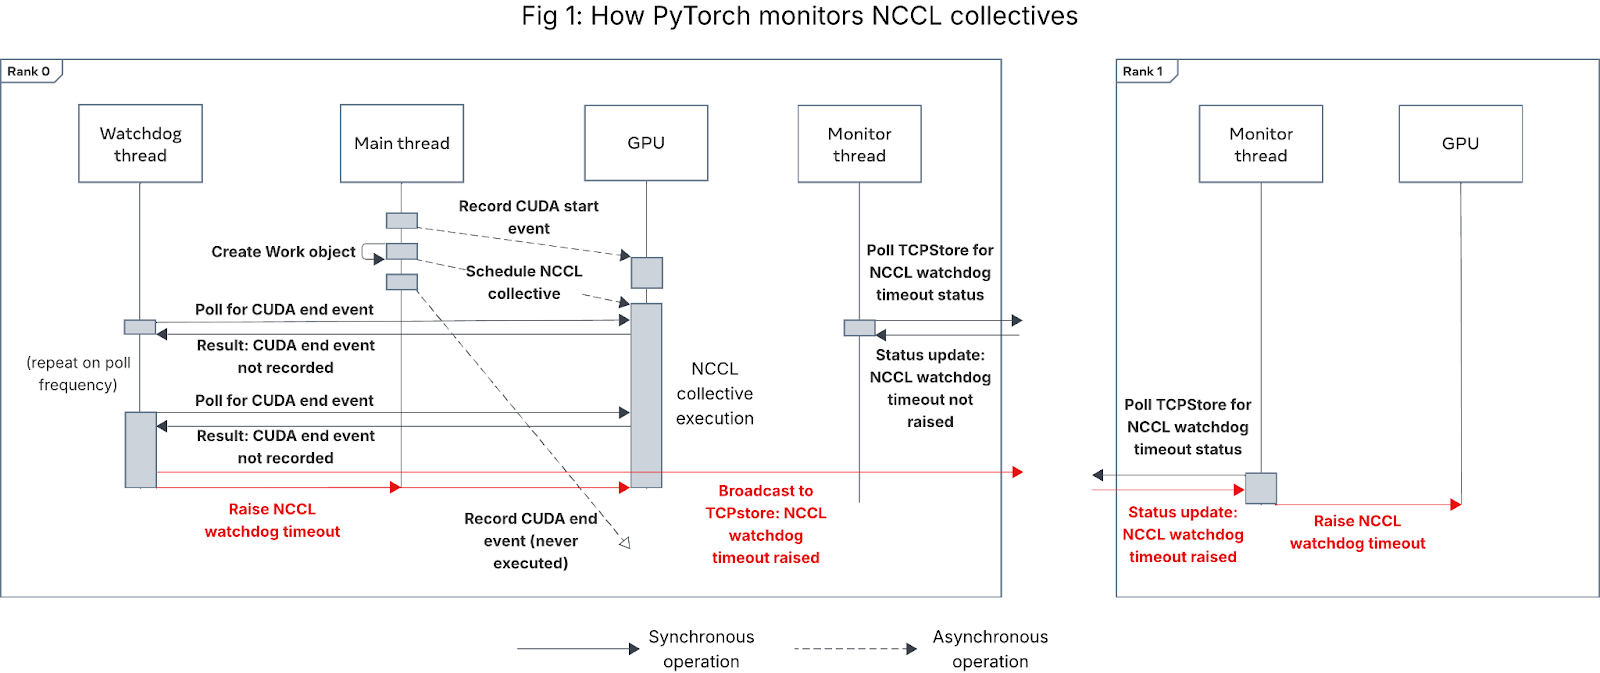
Figure 1: Sequence diagram showing how PyTorch monitors NCCL collectives
Why is the NCCL watchdog timeout hard to debug?
NCCL watchdog timeout errors are hard to debug for two major reasons.
First, the NCCL watchdog timeout is what we call a “catch-all” error – anything that can cause a rank to wait indefinitely on a collective can lead to a NCCL watchdog timeout, not just collective slowness or network/NCCL library issues. As we describe in the next section, this includes CPU-side hang, GPU hang, CUDA deadlock, invalid collective arguments, hardware/network issues, etc.
Second, the error message is largely unhelpful. Since the error is raised from the watchdog thread, to reduce the potential for the watchdog thread to itself hang, only limited metadata about the collective is logged in the error message. Crucial debugging information, such as the call stack on the PyTorch main thread from which the collective was scheduled, is missing from the error message (the stack trace in the error message is from the NCCL watchdog thread, which is diagnostically irrelevant).
Furthermore, as we explain in the next section:
- The rank that first raises the NCCL watchdog timeout is rarely the culprit that caused the timeout, and
- The collective being executed at the time of NCCL watchdog timeout may not be the cause of the timeout.
Consequently, debugging NCCL watchdog timeout errors without the use of PyTorch Flight Recorder can take hours or longer, often necessitating job reruns with additional debugging flags enabled (e.g., CUDA_LAUNCH_BLOCKING).
Deep dive: What causes NCCL collectives to time out?
To explain the causes of NCCL watchdog timeouts, we first need to describe how PyTorch schedules and executes collectives in a distributed setting (absent a centralized single controller like Monarch).
As mentioned above, PyTorch NCCL collectives are scheduled by the CPU and executed asynchronously on GPU. In most training frameworks, when training resources are being used efficiently, the workload is GPU-bound, so the CPU will schedule a sequence of GPU compute kernels (PyTorch operations) and NCCL collectives onto the GPU, then intermittently blocking wait for the GPU to complete all the scheduled kernels at the next CPU-GPU synchronization point. Figure 2 illustrates this happy path behavior for a 2-rank process group.
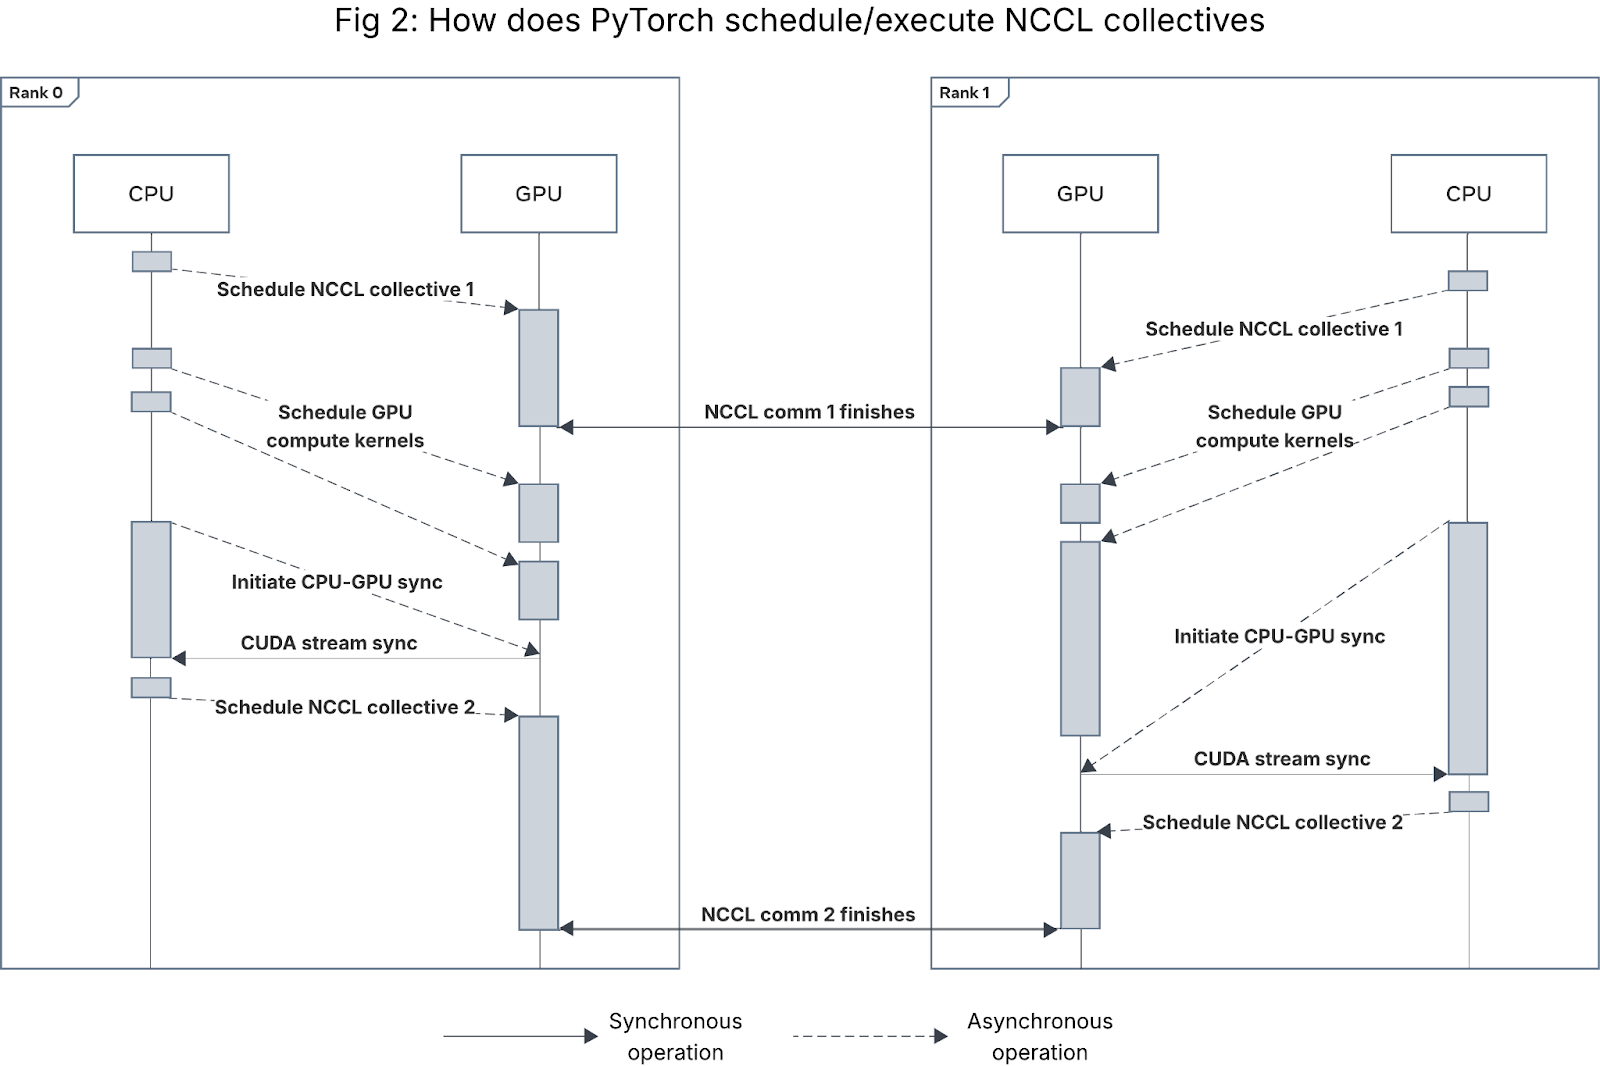
Figure 2: Sequence diagram for how CUDA kernels and NCCL collectives are launched and executed in a 2-rank process group. Gaps between kernel executions on the GPU are exaggerated for readability.
During this process, there are two types of synchronous operations on the GPU:
- Inter-rank GPU-GPU synchronization (i.e., NCCL collectives), in which all GPUs in a process group synchronize their state before continuing with other kernels. Not all NCCL collectives function as barriers, but barrier collectives (e.g., all_reduce) are the most common source of NCCL watchdog timeouts. (There are some other operations such as PyTorch NCCL process group initialization/teardown that require inter-rank GPU sync, but they are beyond the scope of this blog.)
- Single-rank CPU-GPU synchronization, in which the CPU thread associated with a given GPU blocks until the GPU finishes all of its scheduled operations (including compute kernels and communication kernels). This CPU-GPU sync can either be explicit (e.g. a call to torch.cuda.synchronize) or implicit (e.g. moving a tensor from CPU to GPU or vice versa).
There are two ways a collective can time out: either 1) the collective kernel itself takes longer than the timeout to execute or hangs, or 2) ranks desynchronize, causing the collective metadata or state to differ across ranks at timeout.
Based on our experience debugging NCCL watchdog timeouts across Meta’s fleet, almost all NCCL watchdog timeout errors are caused by collective desync (i.e., mismatch), not collective slowness/hang. This means that increasing the timeout value will not fix the issue – the cause of the desync must be resolved.
Figure 3 shows the breakdown of the most common root causes for NCCL watchdog timeouts that we have observed within Meta’s fleet for 4 different training frameworks (three for recommendation systems, i.e., RecSys, and one for LLMs). In the rest of this section, we explain the 4 broad categories of root causes that we have observed: CPU-side issues, GPU compute kernel hang, misconfigured NCCL collective arguments, and network/hardware issues.
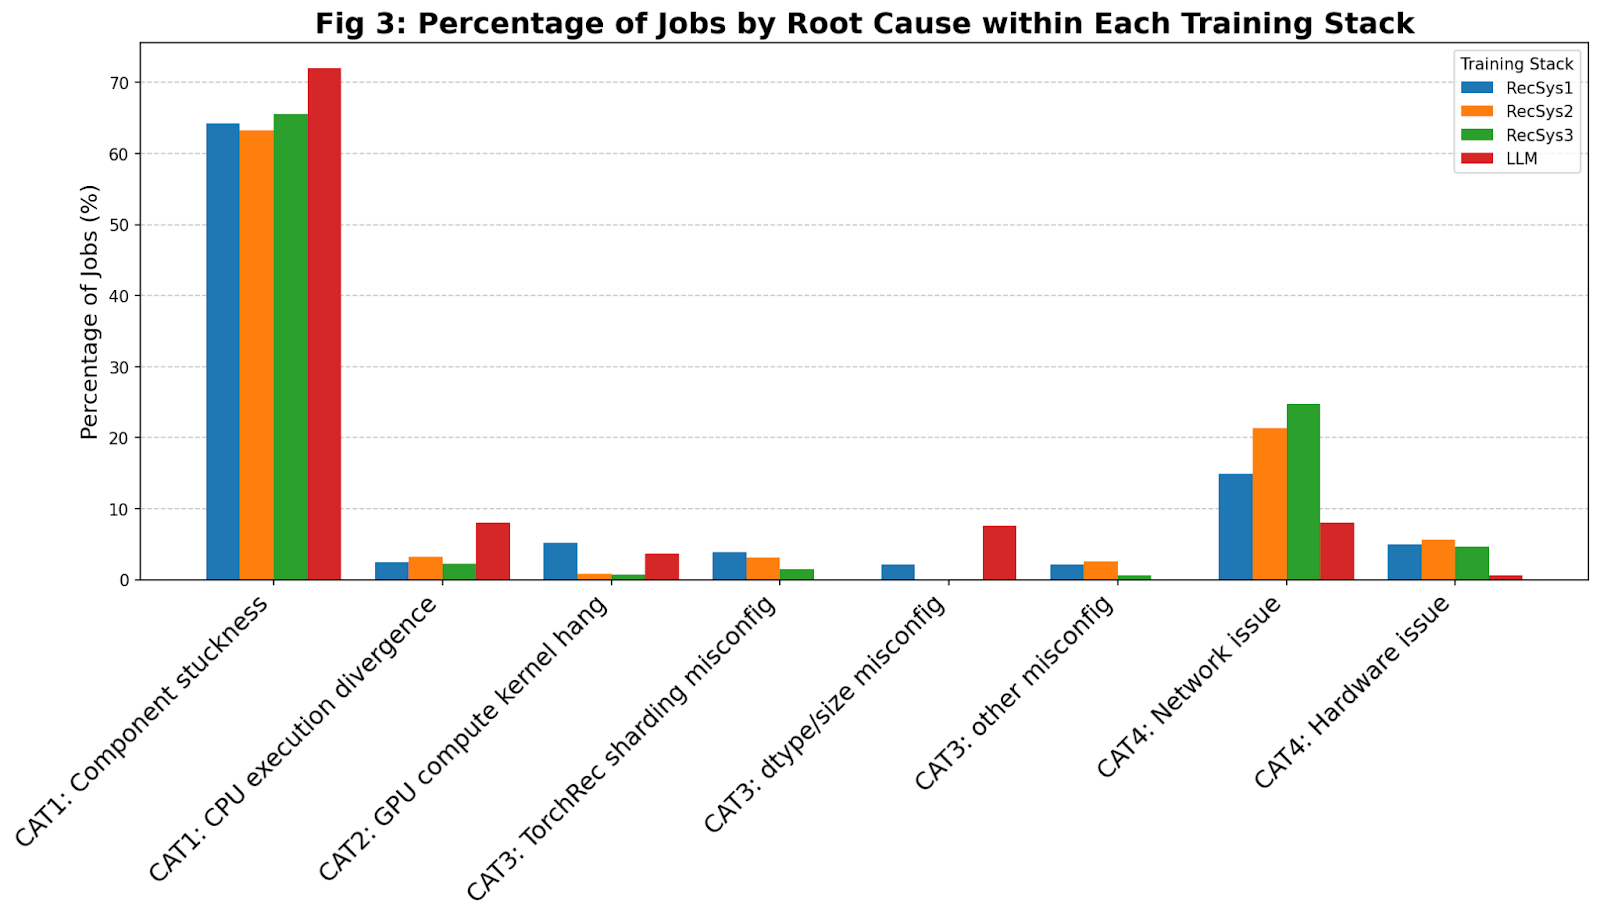
Figure 3: Observed breakdown of NCCL watchdog timeout root causes across various training stacks within Meta
Category 1: CPU-side issues
In most modern model architectures (without a centralized single controller), for NCCL collectives to complete successfully, all ranks in a process group must execute the same (or complementary) NCCL collectives in the exact same order.
Formally, for a given NCCL process group G, let G represent the set of all ranks participating in the process group. Let CipG represent the ith collective executed on rank p ∈ G among all collectives executed within process group G. Then, given ranks p, q ∈ G, ∀ i, CipG must be the same as CiqG. Violation of this expectation will cause the NCCL library to hang indefinitely on the violating collective during CPU-GPU sync, eventually triggering NCCL watchdog timeout.
If, for some reason – entirely unrelated to the GPU, network, or hardware – the CPU ends up scheduling no collective or different collectives on some ranks, that can cause collective desync that leads to NCCL watchdog timeout. Inside Meta’s fleet, we have observed these CPU-side issues to be the dominant root cause for NCCL watchdog timeouts (>60% across all training frameworks).
We broadly divide CPU-side issues into the following two classes:
- Stuckness/slowness in a CPU-side operation
- Cross-rank CPU execution divergence
Stuckness/slowness in a CPU-side operation
As shown in Figure 4, if for a subset of ranks, the CPU gets stuck or takes longer than the NCCL watchdog timeout duration on some CPU-side operation (e.g. data loading, checkpointing, or PT2 compilation), those ranks will fail to schedule the collective on the GPU, causing one of the other ranks that did schedule the collective to raise a NCCL watchdog timeout.
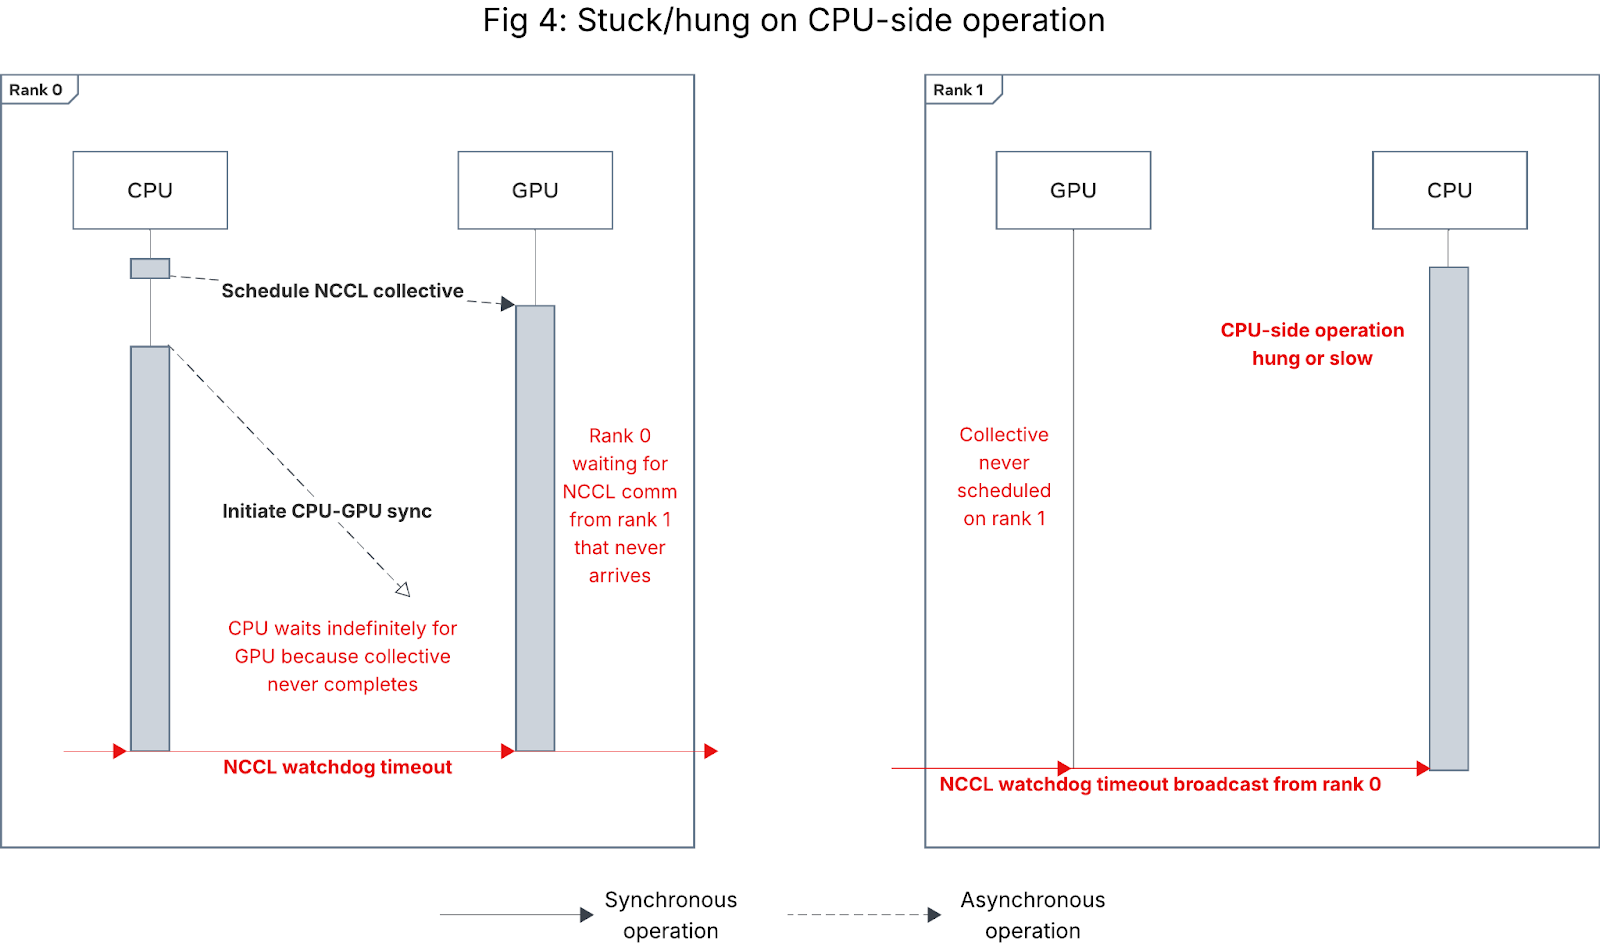
Figure 4: Sequence diagram for NCCL watchdog timeout caused by CPU-side slowness/hang
One notable example of such slowness is in PT2 compilation, where compilation times are known to be data-dependent and can vary even further across ranks when using compiler cache and dynamic shapes recompilation. If the compile time difference between ranks exceeds the NCCL watchdog timeout threshold, it can lead to NCCL watchdog timeouts. This problem directly motivated the introduction of PT2 compiler collectives.
Cross-rank CPU execution divergence
If different ranks entered different code paths, they could end up scheduling different collectives (Figure 5) or failing to schedule a collective (Figure 4). In both cases, some ranks will get stuck at the subsequent CPU-GPU synchronization point and raise a NCCL watchdog timeout.
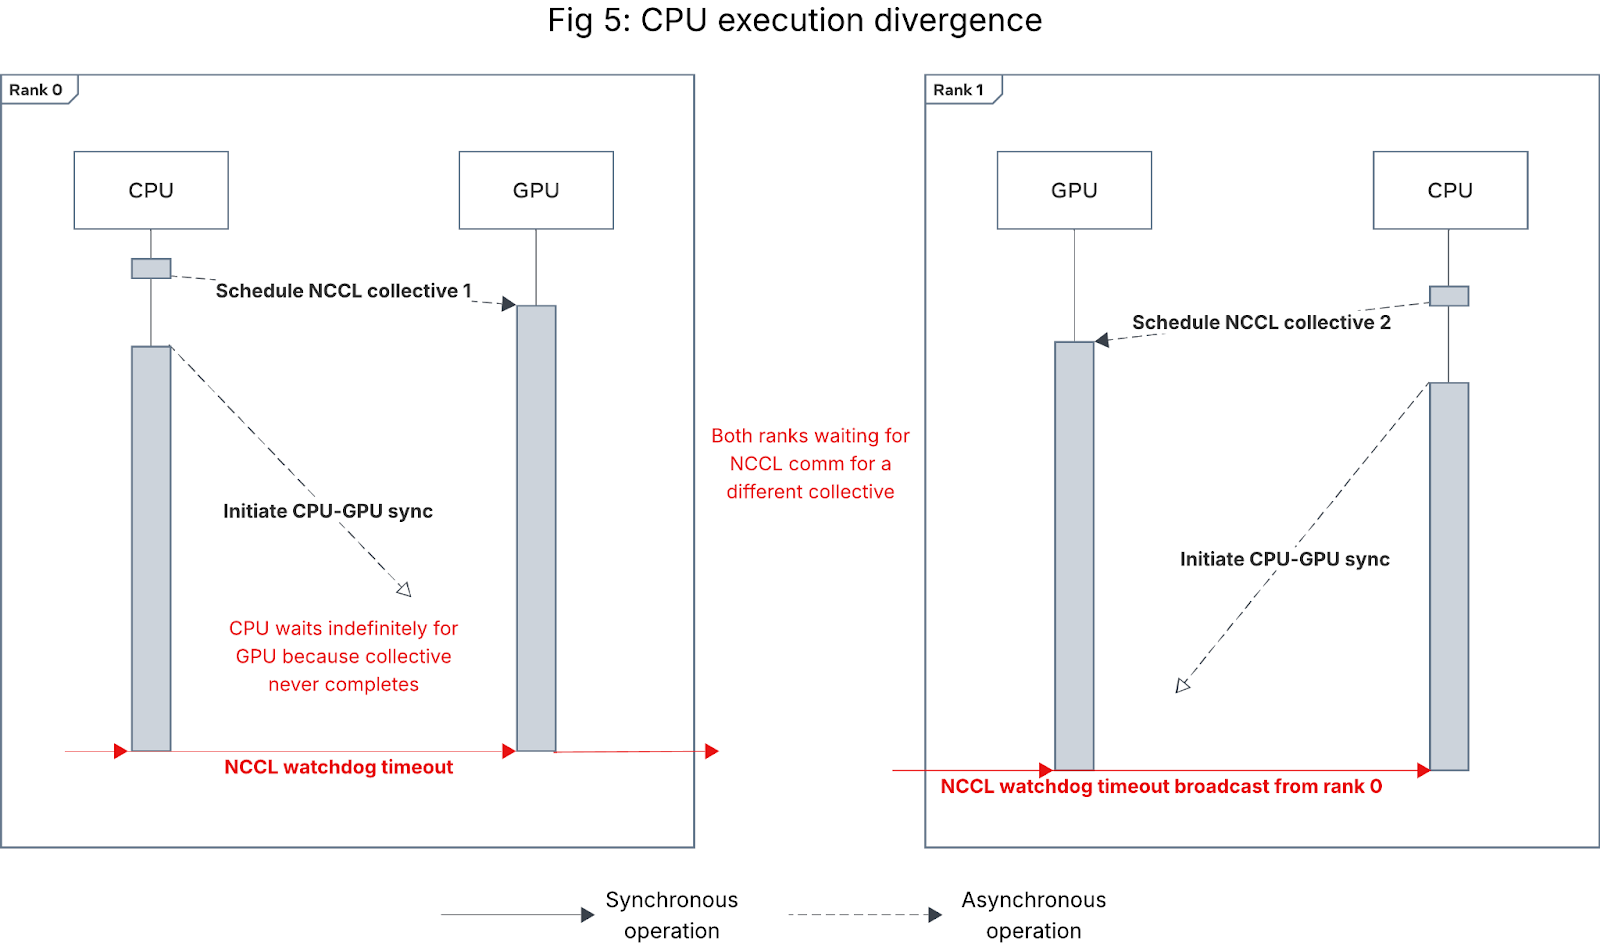
Figure 5: Sequence diagram for NCCL watchdog timeout caused by CPU execution divergence
Here are some common causes for CPU execution divergence based on our experience:
Asymmetric PT2 compilation
If model code is data-dependent, variance in the data provided to ranks at PT2 compilation time can cause asymmetric compilation, resulting in different compiled code across ranks. When this results in different NCCL collectives in the compiled code, it causes CPU execution divergence that looks like Figure 5. In models with PT2 compilation enabled, this has been one of the more common causes of CPU execution divergence we have seen.
Cross-rank data imbalance or heterogeneity
If the model or training framework contains data-dependent conditional logic, data imbalance or heterogeneity across ranks can lead to NCCL watchdog timeouts. One such scenario we have observed is when one rank exhausts data earlier than others and ends up running one fewer iteration, causing it to jump out of the training loop earlier, leading to CPU execution divergence that looks like Figure 4.
Improper error handling
Fatal exceptions during the training loop should normally cause the worker(s) for the erroring rank(s) to tear down, and PyTorch’s error propagation to signal the remaining workers to do the same, even if they are waiting on a NCCL collective. But code in the except blocks are essentially rank-specific conditional logic, which can lead to NCCL watchdog timeouts being raised from a non-erroring rank in any of the following scenarios:
- Except clause gets stuck on the CPU for longer than the NCCL watchdog timeout threshold (looks like Figure 4).
- Except clause contains inter-rank GPU synchronization (e.g., another NCCL collective or destroy_process_group), causing teardown to deadlock with non-erroring ranks (looks like Figure 5).
- Except clause swallows the exception and proceeds with training, causing the erroring rank(s) to either issue new NCCL collectives and deadlock (Figure 5) or get stuck at a CPU-side barrier or in a CPU-bound operation (Figure 4).
Edge case: Collective GPU execution reordering
In most cases, collective CPU scheduling order is the same as the GPU execution order. However, in models using N-D parallelism (e.g., FSDP), when collectives are scheduled to the same GPU by different process groups without proper synchronizations (i.e. back-to-back), there is a small chance that the GPU communication kernel execution order can become inconsistent across rank, causing deadlock that looks like Figure 5 and leads to NCCL watchdog timeout. To alleviate this issue, NCCL 2.26 introduces an environment variable NCCL_LAUNCH_ORDER_IMPLICIT to enforce the GPU communication order to be the exact same as the scheduling order.
Category 2: GPU compute kernel hang
Since GPU execution is sequential within a single CUDA stream, any hang on the GPU while executing compute kernels will prevent the GPU from executing scheduled collectives, causing the job to get stuck at the subsequent CPU-GPU synchronization on the stream, as shown in Figure 6 below. Note the symptom depends on the timing of the synchronization: if the CPU-GPU sync occurs after the compute kernel hangs but before the NCCL collective is scheduled, the behavior looks like Figure 4 instead.
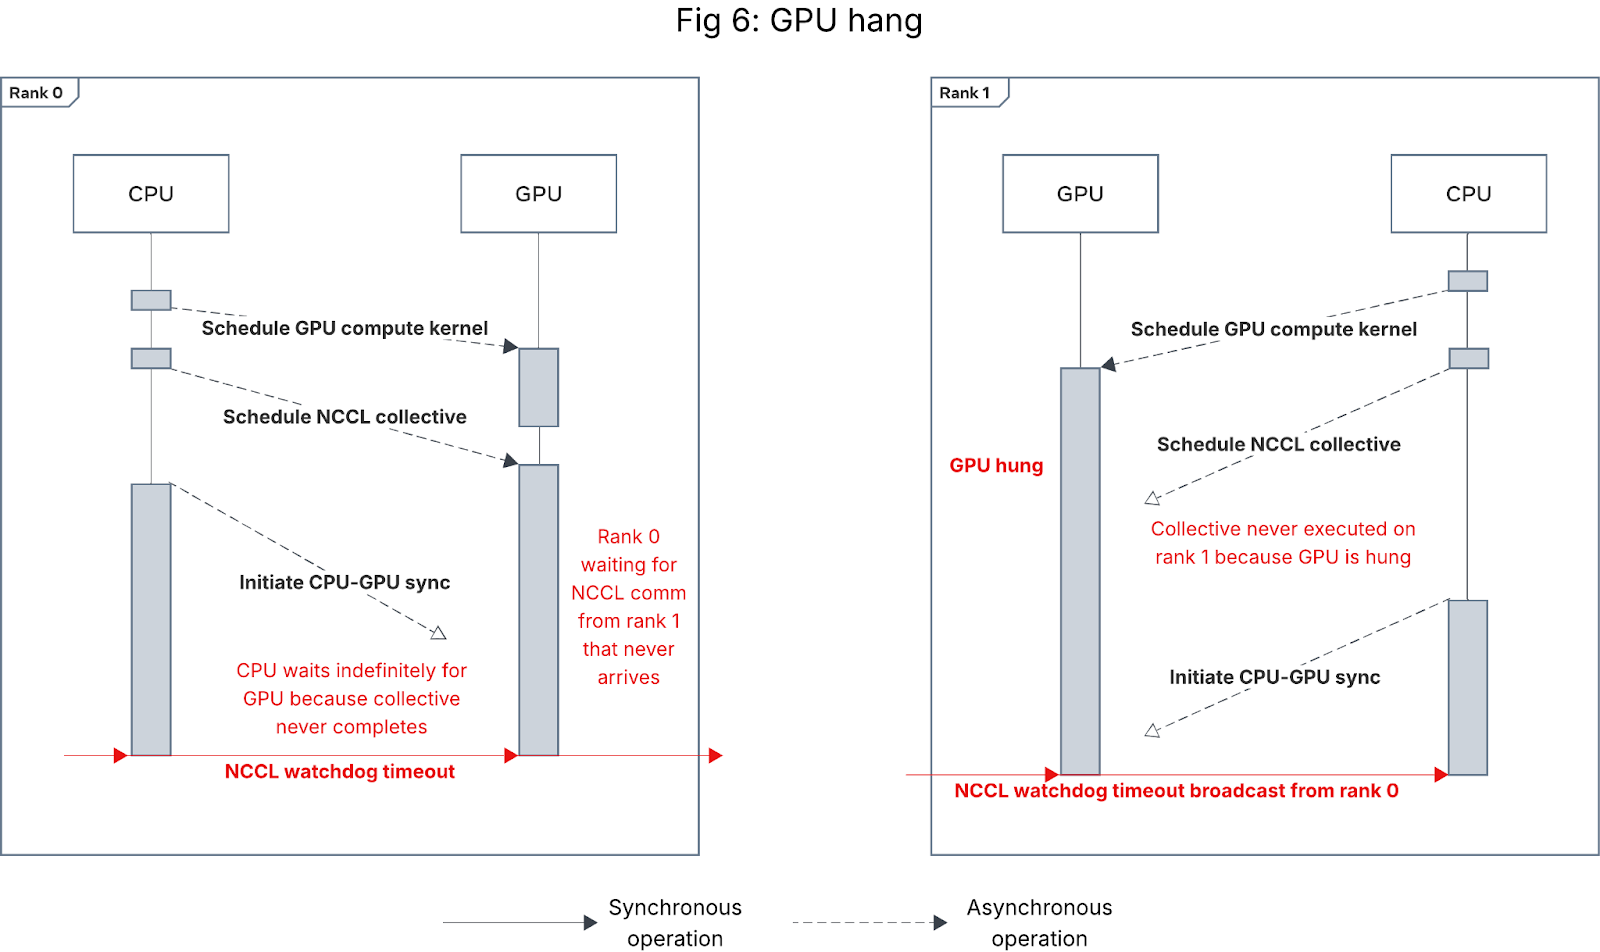
Figure 6: Sequence diagram for NCCL watchdog timeout caused by GPU hang
GPU hangs can be caused by myriad issues; we designate this category for those caused by specific kernel implementations or transient GPU issues isolated to a particular job or model, and describe faulty GPU hardware-induced hangs in Category 4 below.
Category 3: Misconfigured collective arguments
Usually, a NCCL collective takes in one input tensor and emits one output tensor. In most cases, these input/output tensors’ data types and shapes must be the same across all ranks in the process group. There are also some NCCL collectives like all_to_all_single, broadcast and gather that have special global requirements on the input arguments across the PG (e.g., sum of all input sizes must be the same as sum of all output sizes). PyTorch is not able to verify whether the passed-in arguments are valid or not, so when the arguments violate these NCCL assumptions, the NCCL library will hang on the violating collectives and eventually cause NCCL watchdog timeout.
One common case we have observed in Meta’s fleet is on all_to_all_single. Due to the P2P nature of its implementation, it requires the caller to define the send/recv topology by passing in the input/output tensor size splits. In the case of an invalid split – e.g., rank X is expecting more data from rank Y than that rank Y is sending to rank X, the ncclRecv on rank X will block forever and never finish the all_to_all collective.
Category 4: Network or hardware issue
Last but not least, between 20-30% of the timeouts we have observed are caused by either transient or persistent network or hardware issues.
Transient network issues (e.g., link or port flaps) constitute the bulk of such failures. Transient network issues are one of the few cases that can manifest without a desync, where all collectives have started but none have completed. However, for collectives where ranks behave asymmetrically (e.g., all_reduce or broadcast), more commonly, we see some ranks having completed the collective while others are still executing them.
Faulty GPU hardware is a common cause for GPU hang and manifests the same as Category 2 timeouts. However, unlike Category 2, a faulty GPU will induce failures across multiple, unrelated jobs. Diagnosis requires looking for a repeated pattern of failures for a given GPU (including other CUDA errors) or at hardware signals (e.g., XIDs).
PyTorch’s diagnostic solution: Flight Recorder
To meaningfully help users debug the NCCL watchdog timeout error, PyTorch implements Flight Recorder (FR) inside the c10d layer. When a timeout occurs, FR automatically dumps critical logging information to storage, enabling users to perform post-timeout analysis for detailed investigation.
What is Flight Recorder?
FR is a per-rank, CPU-side ring buffer, shared globally across all process groups. FR records the following essential metadata related to collective launches:
- Type: NCCL collective type (e.g. all_reduce, all_to_all, etc.)
- State: Collectives go through 4 states: not scheduled (a.k.a. missing) → scheduled (from CPU) → started (on GPU) → completed (on GPU)
- Input/output dtype: Similar to GPU compute kernels, NCCL collectives take in tensors as input parameters and can also output a tensor. The dtype (data type) refers to the input/output tensor dtype
- Input/output size: The input/output tensor size for the NCCL collectives
- Collective call stacks: The CPU-side call stack from which the NCCL collective was scheduled (both Python and C++ call stacks can be recorded)
Collectives are also indexed by a sequence ID that is monotonically increasing within each process group the rank participates in. This metadata is crucial for later cross-rank verification of collective usage and ordering.
A Python API allows users to retrieve Flight Recorder data from the ring buffer in real-time for streaming telemetry analysis. Users can also manually trigger a dump of FR records to storage by writing to a pipe file (configured using environment variable TORCH_NCCL_DEBUG_INFO_PIPE_FILE or through HTTP request. Most importantly for this post, in the case of TORCH_NCCL_DUMP_ON_TIMEOUT is set, when a NCCL watchdog timeout is detected, PyTorch triggers the immediate dump of FR records to storage (local filesystem by default, but it is extensible).
The key to a successful FR dump is ensuring that all ranks, even the one that is hanging, dump their records. Historically, ranks could hang on both the CUDA and watchdog threads, leading to only a partial set of timeout records. To solve this, PyTorch introduces a side TCP/IP channel, leveraging TCPStore (a TCP/IP-based key-value store), to broadcast timeout signals to all ranks. A dedicated monitor thread polls the TCPStore and triggers the FR dump upon signal receipt. See Fig. 7 for details.
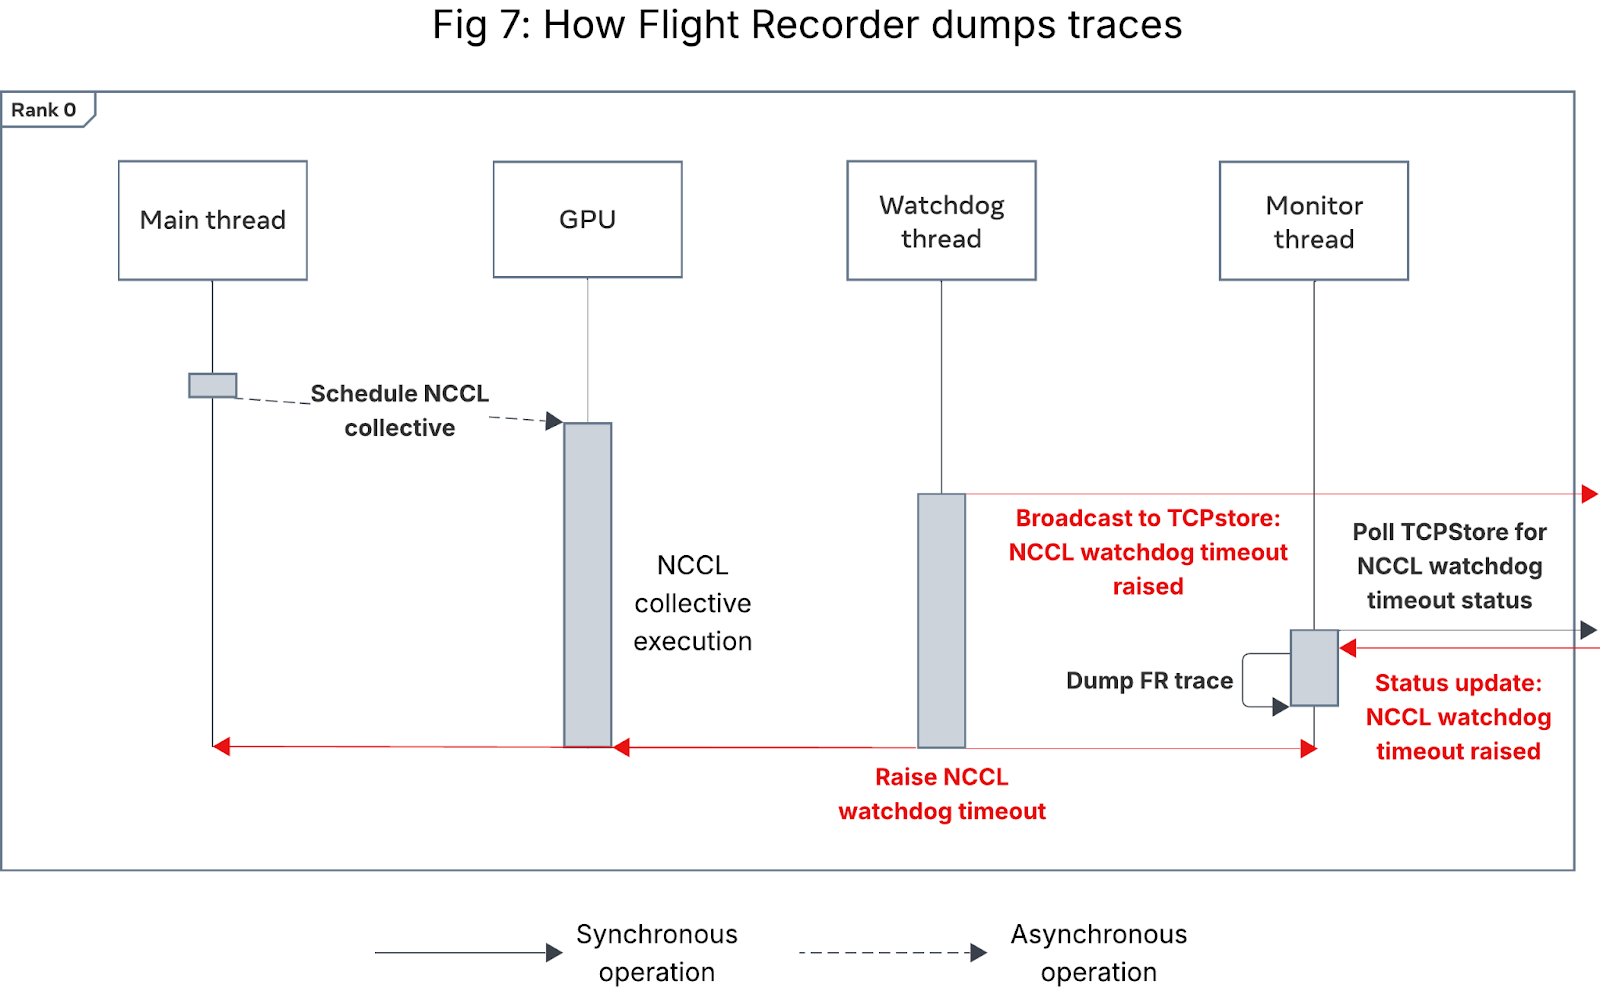
Figure 7: Sequence diagram showing how Flight Recorder dumps traces
The FR dump is triggered at the level of each process group. In complex N-D parallelism scenarios, users manage multiple process groups, each of which has its own watchdog and monitor thread. To mitigate race conditions, only the monitor thread of the default process group (sized to the world size) is designated to check for signals and initiate the dump. All other monitor threads are instructed to sleep briefly (e.g., for 1 minute) to allow sufficient time for the dump to complete. PyTorch Flight Recorder relies on a best-effort local dump because the system is inherently fragile during a timeout. This design has proven effective, yielding a near 100% Flight Recorder full dump rate (i.e., all ranks completing the dump before teardown) inside Meta’s fleet.
Within Meta’s fleet, FR dump on timeout is enabled for all jobs across most training stacks. The minor overhead from enabling FR for every job is outweighed by the value of the telemetry in debugging NCCL watchdog timeouts when they occur. Upon job termination, external orchestration aggregates the FR dumps from all ranks and post-processes them for offline analysis (described below).
Note: When analyzing FR dumps for a NCCL watchdog timeout, offline post-timeout analysis is preferred over real-time analysis. This is for the same reason that there is limited coordination between ranks during the timeout (aside from the signal broadcast) – the system is already fragmented, and not all ranks can be expected to remain alive. If even a single rank were to die, inter-rank coordination would eventually fail. Furthermore, having threads blindly wait for an extended period of time would waste valuable training resources. Historical experience with tools like desync-debug for PyTorch users showed performance regressions and scaling issues in large-scale model training. Consequently, we made the architectural decision to first dump the raw FR records and perform a thorough analysis afterwards.
How to leverage FR dumps for post-timeout analysis?
To effectively use FR data for debugging NCCL watchdog timeouts, it is first necessary to align the collective records from all ranks by their scheduling order and collective metadata (sequence ID, collective type, etc.) and to aggregate collective records within each process group (PG). Each group of records, which correspond to a single collective being executed within a particular PG, can then be examined to identify mismatches – i.e., which rank(s) failed to schedule the collective (i.e., missing ranks) or diverged from the others in the same PG.
These collective mismatches allow one to pinpoint which of the categories described in the deep dive above was the root cause of the NCCL watchdog timeout:
- Category 1: Stuckness/slowness on CPU-side operation usually manifests as a missing rank or collective state mismatch, whereas cross-rank CPU execution divergence may manifest as a missing rank or mismatch in collective type, call stack, and occasionally dtype.
- Category 2: GPU hang most often manifests as a missing rank or collective state mismatch, depending on whether CPU-GPU synchronization occurs before or after the NCCL collective is scheduled.
- Category 3: Misconfigured collective arguments usually manifest as a collective dtype or size mismatch.
- Category 4: Faulty hardware usually manifests the same as GPU hang (missing rank or collective state mismatch), but network issues can manifest without a mismatch (with collectives all in the
startedstate) or as a collective state mismatch. Typically, these must be diagnosed by looking for repeat patterns of failure when the same network/hardware components are involved, as they may be transient or gray failures.
PyTorch provides the fr_trace diagnostic tool to perform the abovementioned alignment and aggregation given the FR dumps from all ranks. fr_trace enumerates all NCCL collective mismatches, outputting the participating ranks for those collectives, collective metadata, and the collective call stack for one representative participating rank.
Within Meta, we have augmented fr_trace by developing a visualization of the distributed collective activity across ranks and process groups, a mockup of which is shown in Figure 8. The visualization is powered by the aligned collective records generated by fr_trace, which we write to a tabular store (including collective metadata) during postprocessing.
Successive columns along the X-axis represent the global, PG-agnostic collective scheduling order recorded by FR, and each row along the Y-axis corresponds to a distinct combination of global rank and process group (ranks can appear multiple times if participating in multiple PGs). Individual cells correspond to individual collectives and are color coded such that distinct combinations of {collective type, call stack} have different colors. Selecting a cell or group of cells loads an icicle chart of their call stacks (Figure 9).
We have published a proof-of-concept PyTorch PR here to demonstrate the post-processing and visualization using OSS libraries.
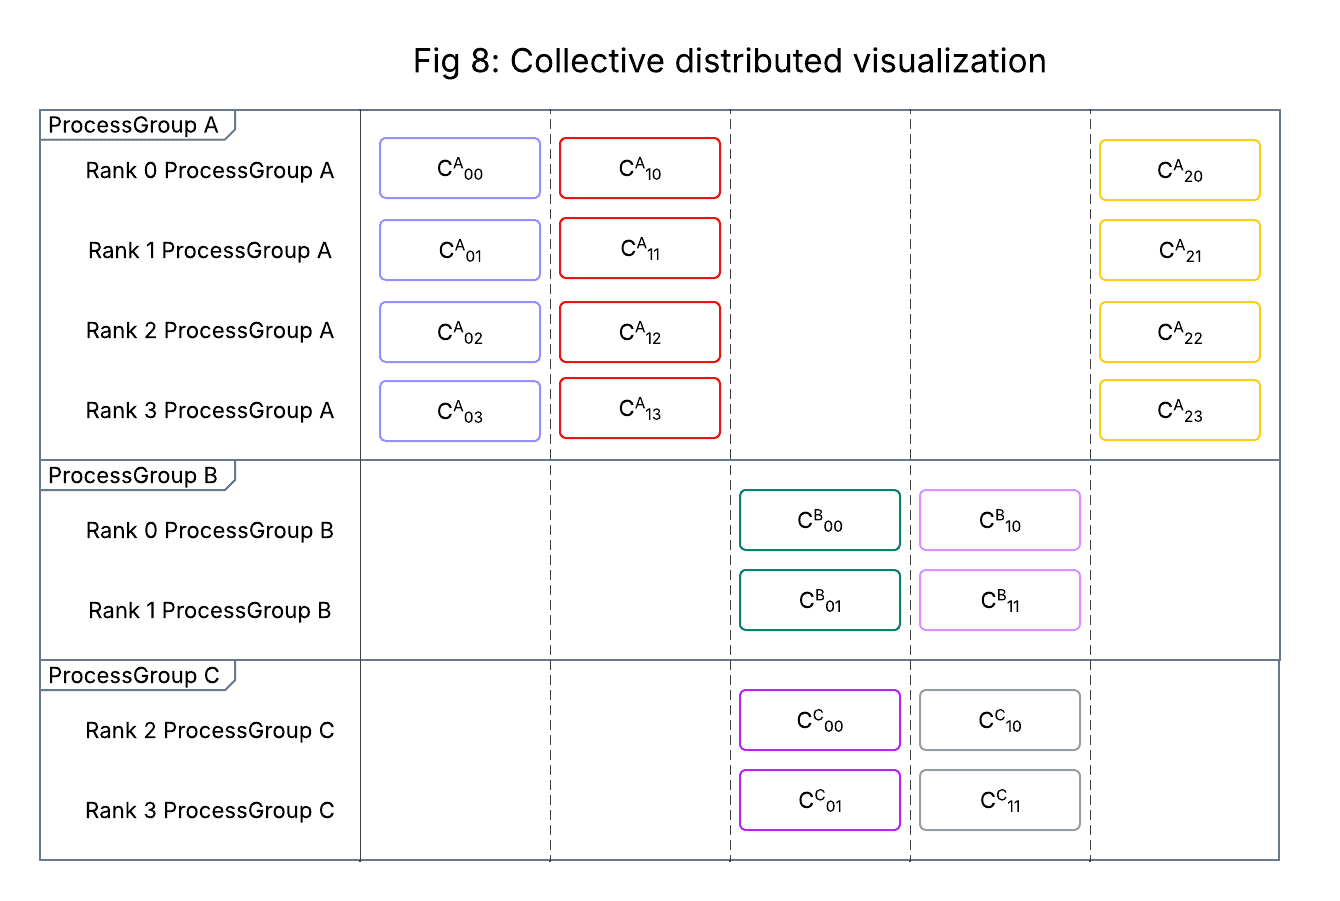
Figure 8: Mockup of the visualization used within Meta to inspect NCCL collectives when debugging timeouts
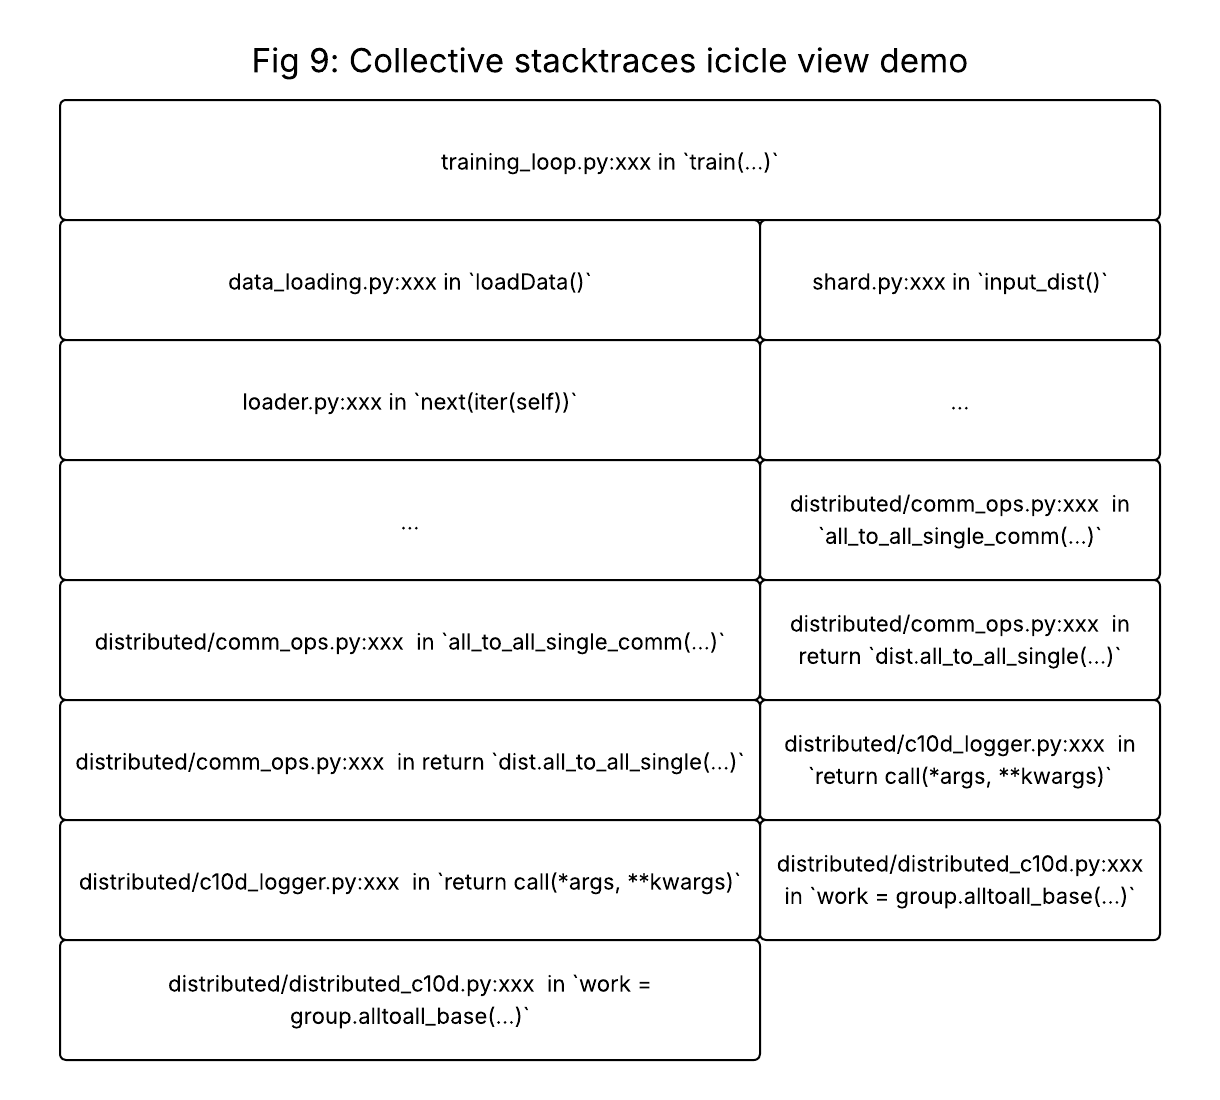
Figure 9: Mockup of the call stack icicle view produced when multiple cells are selected
This visualization has proven incredibly powerful in debugging NCCL watchdog timeouts. It facilitates quick scanning of the history of collective activity within and across ranks, and the color coding makes it easy to visually identify mismatched collectives. The ability to quickly compare collective call stacks for mismatched collectives is particularly useful for pinpointing the source of CPU-side divergence.
Grouping ranks by PG is particularly helpful when debugging jobs that use N-D parallelism (e.g. FSDP) – the visualization makes it easy to switch between examining the collective activity within each PG and across all PGs a given rank is participating in. It has proven effective for debugging cases of cross-PG collective scheduling race conditions.
Note: For effective debugging, FR needs to be coupled with a similar distributed visualization of CPU main thread call stacks, as understanding what the CPU was doing at timeout (CPU-side operation? CPU-side barrier? CPU-GPU synchronization point? exception handling?) is necessary to triangulate which of the categories the timeout belongs to. While PyTorch does not currently provide any diagnostic tools for this, the underlying telemetry could be collected using OSS tools like py-spy.
Case studies based on Meta workloads
Case one: CPU execution divergence
A common challenge when scaling recommendation systems with distributed training is managing cross-rank CPU execution divergence. We have seen this issue surface during metric computation, where results from multiple ranks must be aggregated using collective communication primitives and logged. Normally, every rank should participate in these NCCL collective calls to ensure accurate and synchronized metric aggregation. However, if the implementation is not sufficiently robust, some ranks may inadvertently skip these calls – either due to conditional logic, early exits, or other code path divergences.
When this happens, the membership of ranks in the collective operation becomes incomplete. Participating ranks may end up waiting indefinitely for input from ranks that opted out, leading to stalled training and eventually NCCL watchdog timeout. Figure 10 below illustrates this phenomenon: the last column shows the divergence in code paths, with some ranks executing the metric aggregation collective (yellow) while others proceed to the next NCCL operation without participating in metric aggregation (black).
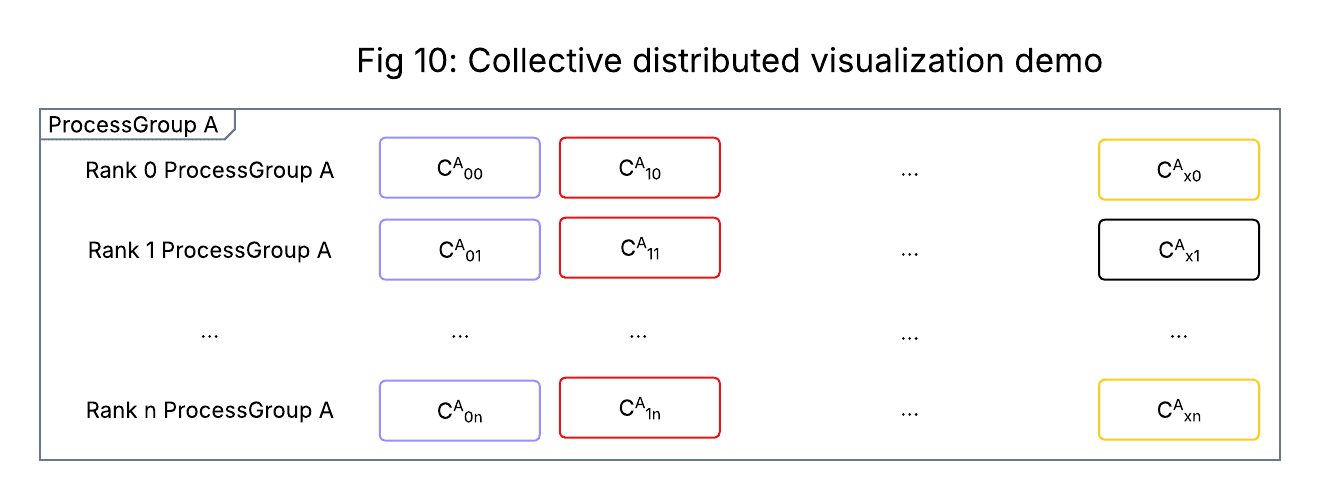
Figure 10: Example collective visualization for CPU execution divergence
In one instance of this type of divergence, through analysis of the divergent collective and CPU call stacks, we isolated the root cause to faulty conditional logic in the training code causing metrics computation to be skipped by ranks that met certain data-related conditions.
Case two: Misconfigured NCCL collective inputs
GPU-to-GPU communication hangs are a well-known challenge in large-scale distributed training, especially in recommendation systems (RecSys). The all_to_all collective operation is widely used in RecSys workloads, as sharded embedding tables require both the inputs and the pooled outputs to be gathered and redistributed across all ranks. This ensures that each rank receives a complete set of embeddings for its batch, enabling efficient parallel processing. A critical detail in using all_to_all is the specification of input and output splits. If these splits are not explicitly provided, the PyTorch c10d all_to_all_single API expects that the input tensors have the same length across all ranks. This requirement allows the underlying implementation to evenly redistribute elements, maintaining synchronization and preventing deadlocks.
In one internal RecSys scenario, we encountered a situation where GPUs became stuck in two different all_to_all calls: one with even splits and another with uneven splits. At first glance, all ranks seemed to be executing the same all_to_all collective, which led to confusion during debugging. Our initial hypothesis focused on why different all_to_all variants were triggered, but this line of inquiry did not reveal the root cause. The breakthrough came when we examined the call stacks provided by FR for the all_to_all collectives – we discovered that the mismatched all_to_all variants originated from two different, consecutive collective operations. Due to misconfigured input sizes, some ranks prematurely completed the first all_to_all and moved on to the next, while others remained stuck waiting in the initial collective. This misalignment caused a communication hang, as ranks were waiting for each other in different collective operations.
Future work
We plan to invest in the following areas for Flight Recorder’s future development and integration:
- Integration with TorchComm: We plan to integrate Flight Recorder into the recently announced TorchComm library.
- Support for Host-Side Optimizations: As accelerators evolve and host-side optimizations like CUDA graphs become common, we must validate and extend the Flight Recorder’s design to ensure composability with these techniques.
- Onboarding Additional Backends: Since Flight Recorder is already designed to be generic, we plan to expand its scope beyond NCCL to include other backends, such as MTIA and Gloo.
Acknowledgements
We would like to thank the following collaborators at Meta for their various contributions, feedback, support, and guidance for this work: Tristan Rice, Will Constable, Zachary DeVito, Shuqiang Zhang, Chirag Pandya, Iris Zhang, Yue Dong, Ke Wen, Chao Chen, Chien-Chin Huang, Zack Cao, Atul Jangra, David Lai, Hang Qi, Jayesh Seshadri, Shai Duvdevani, Haibo Chen, Shyam Sundar Chandrasekaran, Karthik Kambatla.