
Summary
Recently, the PyTorch team released KernelAgent, an open agentic system achieving 100% correctness across all 250 L1/L2/L3 KernelBench tasks. In this post, we extend that work by adding a hardware-guided optimization layer to the existing framework. Building on the previous correctness-focused pipeline, KernelAgent integrates GPU hardware-performance signals into a closed-loop multi-agent workflow to guide the optimization for Triton Kernels.
We evaluate the kernels generated by KernelAgent on all 100 L1 KernelBench tasks. Overall, it achieved 2.02x speedup over generated kernels from earlier versions. On average, KernelAgent generated 1.56x speedup when compared to default torch.compile, outperforming 65 of 100 KernelBench L1 tasks and achieving 89% of the hardware roofline efficiency on the H100.
The optimization codebase is located at KernelAgent repo with documentation to get started. We also share a selection of end-to-end KernelAgent optimization artifacts in the open-source repo.
Introduction
Optimizing GPU kernels is increasingly critical for modern AI workloads. As models grow larger and more specialized, performance is often bounded not by high-level algorithms, but by the efficiency of the kernels that implement them. Yet manual kernel optimization remains expertise-intensive, requiring deep knowledge of GPU architectures, memory hierarchies, and performance trade-offs. This challenge compounds as the number of kernels grows and as each new GPU architecture demands rethinking optimization strategies.
In practice, experienced kernel engineers follow a systematic workflow when optimizing kernels. They profile kernels using tools such as NVIDIA Nsight Compute, examine hardware performance counters to diagnose bottlenecks, and iteratively apply targeted optimizations. Is register pressure killing occupancy? Is the tiling strategy leaving memory bandwidth on the table? Does the kernel need an architectural redesign, not just parameter tuning? This process can require reasoning through multiple distinct kernel architectures each exposing a different bottleneck before converging on a design that saturates the hardware. While effective, this iterative cycle typically takes days or weeks.
Modern compiler stacks have made significant progress toward automating kernel generation. torch.compile captures computation graphs and generates Triton kernels using a combination of graph transformations, pattern matching, and compiler heuristics. Similar approaches in systems such as TVM and XLA cover many common kernel patterns and deliver strong out-of-the-box performance. However, most compiler heuristics are guided by static models rather than direct measurements from real hardware execution.
KernelAgent is designed to automate this diagnosis-driven optimization loop by grounding kernel optimization in real hardware signals. It targets forward-pass (inference) kernels, where latency and throughput directly impact serving costs and user experience. It is built on three core principles:
Ground everything in hardware metrics. Both bottleneck diagnosis and optimization prescriptions must be derived from real profiling data.
Explore optimization paths in parallel. Given the same hardware signals, multiple valid optimization strategies may exist. KernelAgent evaluates these strategies concurrently, reducing wall-clock optimization time and synthesizing previous approaches into evolved algorithmic discoveries.
Learn across rounds through shared memory. Optimization agents reflect on what succeeded and failed in each round, summarizing insights into a shared memory that guides subsequent iterations and prevents repeated dead ends.
KernelAgent Optimization Workflow
 Figure 1: Overview of the optimization workflow. The optimization started by taking the input kernel as the baseline to optimize. ProfilerAgent (collect hardware signal), JudgeAgent (diagnose bottleneck), AnalyzeAgent (prescribe recommendations), Orchestrator Agent (synthesize knowledge), Optimization Manager (explore different optimization through multiple optimization agents), BenchmarkAgent (measure performance). Arrows show data flow between agents.
KernelAgent automates the workflow that experienced kernel engineers already follow—profiling, diagnosing bottlenecks, proposing optimizations, and iterating—by decomposing it into a set of cooperating agents. Each agent is responsible for a well-defined stage of the optimization loop, and together they form a closed, hardware-guided feedback system.
Figure 1 illustrates the overall workflow. Starting from an input kernel, KernelAgent repeatedly profiles the kernel, diagnoses performance bottlenecks, prescribes architecture-aware optimizations, synthesizes optimization knowledge, explores alternative optimization paths in parallel, and measures each candidate. Arrows indicate the flow of information between agents across optimization rounds. At a high level, each optimization round consists of the following stages:
Profile → Diagnose → Prescribe → Orchestrate → Explore → Measure
Each stage produces structured outputs that feed directly into the next, enabling fast, data-driven iteration.
How Data Flows Through the System
Profiling: Collecting Hardware Signals
The optimization loop begins with the Profiling Agent inspecting the input kernel using NVIDIA Nsight Compute (NCU). KernelAgent integrates NCU to capture hardware-level performance metrics, including but not limited to DRAM throughput and utilization, L2 cache hit rates, Warp occupancy and stall reasons, and compute and tensor core utilization, and Speed-of-Light (SOL) metrics. These metrics provide the empirical foundation for all downstream decisions.
Input: kernel code + input specification (shapes, dtypes)
Output: structured dictionary of hardware metrics
Sample output:
{
   "sm__inst_executed_pipe_tensor.avg.pct_of_peak_sustained_active": 0.41,
   "smsp__warp_issue_stalled_short_scoreboard_per_warp_active.pct": 5.63,
   "gpu__compute_memory_throughput.avg.pct_of_peak_sustained_elapsed": 48.86
  ...
}
Diagnosis: Identifying Bottlenecks with Roofline Analysis
The Diagnose Agent interprets profiling metrics to classify the kernel’s dominant performance bottleneck. It performs a roofline-style analysis using SOL metrics and combines this with LLM-based reasoning for root cause analysis.
Input: NCU metrics + current kernel code
Output: BottleneckReport with:
- Primary bottleneck category
- Efficiency percentage (max of compute/memory SOL)
- Root causes with evidence (specific metrics cited)
Example diagnosis:
        "category": "memory",
        "summary": "Kernel is memory-bound at 70.3% DRAM throughput with significant long scoreboard stalls from memory latency",
        "reasoning": "The roofline analysis shows Memory SOL at 70.3% while Compute SOL is only 45.2%...",
        "root_causes": [
            { "cause": "High memory latency stalls due to long scoreboard waits blocking warp execution",
              "evidence": [
               {"metric": "smsp__warp_issue_stalled_long_scoreboard_per_warp_active.pct", "value": 37.69, "interpretation": "37.7% of warp stalls are due to waiting for memory operations (global/shared memory loads), indicating memory latency is a significant bottleneck"},
                    {"metric": "sm__warps_active.avg.pct_of_peak_sustained_active", "value": 30.08, "interpretation": "Only 30% warp occupancy suggests insufficient parallelism to hide memory latency"}
                ]...
            },
Prescribing Fixes: Architecture-Aware Recommendations
Given the diagnosed bottleneck, the Analyzer (Prescriber) Agent generates concrete, architecture-aware optimization recommendations. It combines bottleneck classification, GPU specifications (e.g., A100 vs H100) and the retrieved optimization patterns from a curated database. This enables KernelAgent to tailor recommendations to the target hardware.
Input: BottleneckReport + GPU specifications + Optimization Database + kernel code
Output: A List of prescribed fixes with rationale
Example prescription:
"recommended_fixes": [
         {"fix": "Increase pipeline depth with more stages (num_stages=4-5) and reduce register pressure by using smaller BLOCK_K or enabling register spilling to shared memory",
    "rationale": "More pipeline stages help hide memory latency by overlapping loads with computation. Reducing register usage from 91 per thread would allow more concurrent warps to better hide the 37.7% long scoreboard stalls and improve the 30% warp occupancy"}
...
        ]
Orchestration: Turning Analysis into Search Strategy
The Orchestrator Agent synthesizes current diagnostics with historical optimization data to formulate a concrete search strategy for the next round. It aggregates prior diagnoses, prescriptions, and outcomes, incorporating search strategy (beam search, greedy search, etc.) and determines which fixes to explore next.
After each round, KernelAgent generates a structured self-analysis: Was the diagnosis correct? Did the fix address the root cause? What worked, and why? This information enables inference-time learning
Input: Prescription fix + Attempt History + Reflexion
Output: Finalized optimization prompt
Example reflexion:
"was_diagnosis_correct": true,
    "was_fix_effective": false,
    "expected_outcome": "...should reduce memory latency stalls by allowing more in-flight memory operations, improving memory throughput and reducing warp stalls",
    "actual_outcome": "Performance degraded significantly by 37.4% (1.0910ms → 1.4996ms)....
    "reasoning": "The fix backfired because: 1) Doubling BLOCK_N (128→256) and BLOCK_K (32→64) dramatically increased shared memory and register usage per block, likely reducing occupancy significantly....",
    "lessons": [
        "Increasing BLOCK_N and BLOCK_K together with num_stages creates compound pressure on shared memory and registers",
        ...
    ],
    "avoid_patterns": [
        "Simultaneously increasing multiple tile dimensions (BLOCK_N, BLOCK_K) along with pipeline stages",
        "...
    ],
    "try_patterns": [
        "Try smaller BLOCK_K (16 or 32) with increased num_stages to reduce register pressure while improving pipelining",
      ...
Exploration: Parallel Optimization
The Optimization Manager executes the exploration phase. It maintains top-K performing kernels and spawns multiple optimization workers per kernel to explore different fixes in parallel. If one optimization path degrades performance, another worker exploring a different fix may succeed, preventing the search to get stuck at local minima. Each worker applies a different optimization, compiles the kernel, and passes it to the Measure Agent.
Input: Kernel candidates + Different optimization plan
Output: Compiled Optimized kernel for evaluation
Example Result:
BeamSearch initialized: 2 kernels × 2 bottlenecks = 4 workers
---------------------------------------
Round 1: 4/4 workers succeeded
--------------------------------
Round 2: 3/4 workers succeeded
...
Measure correctness and performance
The Benchmarking Agent validates correctness and measures real performance for each kernel variant produced during exploration. For each candidate kernel, the agent first runs correctness checks against a trusted reference implementation. Only kernels that pass verification are benchmarked. Performance measurements are conducted using a controlled benchmarking protocol to ensure stability and reproducibility.
Performance measurement:
- Warmup iterations (default: 25) to exclude cold-start effects
- Repeat iterations (default: 100) for stable measurements
- Shared benchmark lock prevents GPU contention between workers
Input: Compiled kernel variant, reference implementation (pytorch), test shape input
Output: Correctness verdict. Measured kernel runtime
Example Result:
Round 1: 4 successful, best new: 7.8000ms
Round 2: 4 successful, best new: 4.0457m
Round 3: 4 successful, best new: 3.1118ms
...
Performance summary
We use triton.testing.do_bench to obtain consistent performance measurements, reporting the mean runtime over 100 repetitions (with >1s warmup) for each kernel variant on H100. Specifically, we compare KernelAgent against:
- KernelAgent correctness-only loop generated kernels (our earlier baseline),
- Out-of-the-box
torch.compile, which refers to PyTorch Inductor with default mode, static shapes (no dynamic shape support enabled), and CUDA graphs disabled.
Over the 100 L1 KernelBench problems, KernelAgent outperforms 65 out of 100 tasks relative to out-of-the-box torch.compile. Overall, KernelAgent achieves 2.02x geometric-mean speedup over the earlier correctness-only baseline, achieves 1.56x vs out-of-the box default torch.compile. It also achieves 89% of the hardware roofline efficiency on the Nvidia H100, where roofline efficiency is derived through max of compute SOL and memory SOL via Nvidia Compute Nsight, i.e., the higher of streaming multiprocessor or memory throughput as a percentage of hardware peak.
We share a selection of end-to-end KernelAgent optimization artifacts in the open source repo. We also tested a few kernels across each category on different input shapes. Across 12 kernels / 144 shapes, we observe similar speedup.
On the effect of test time scaling:
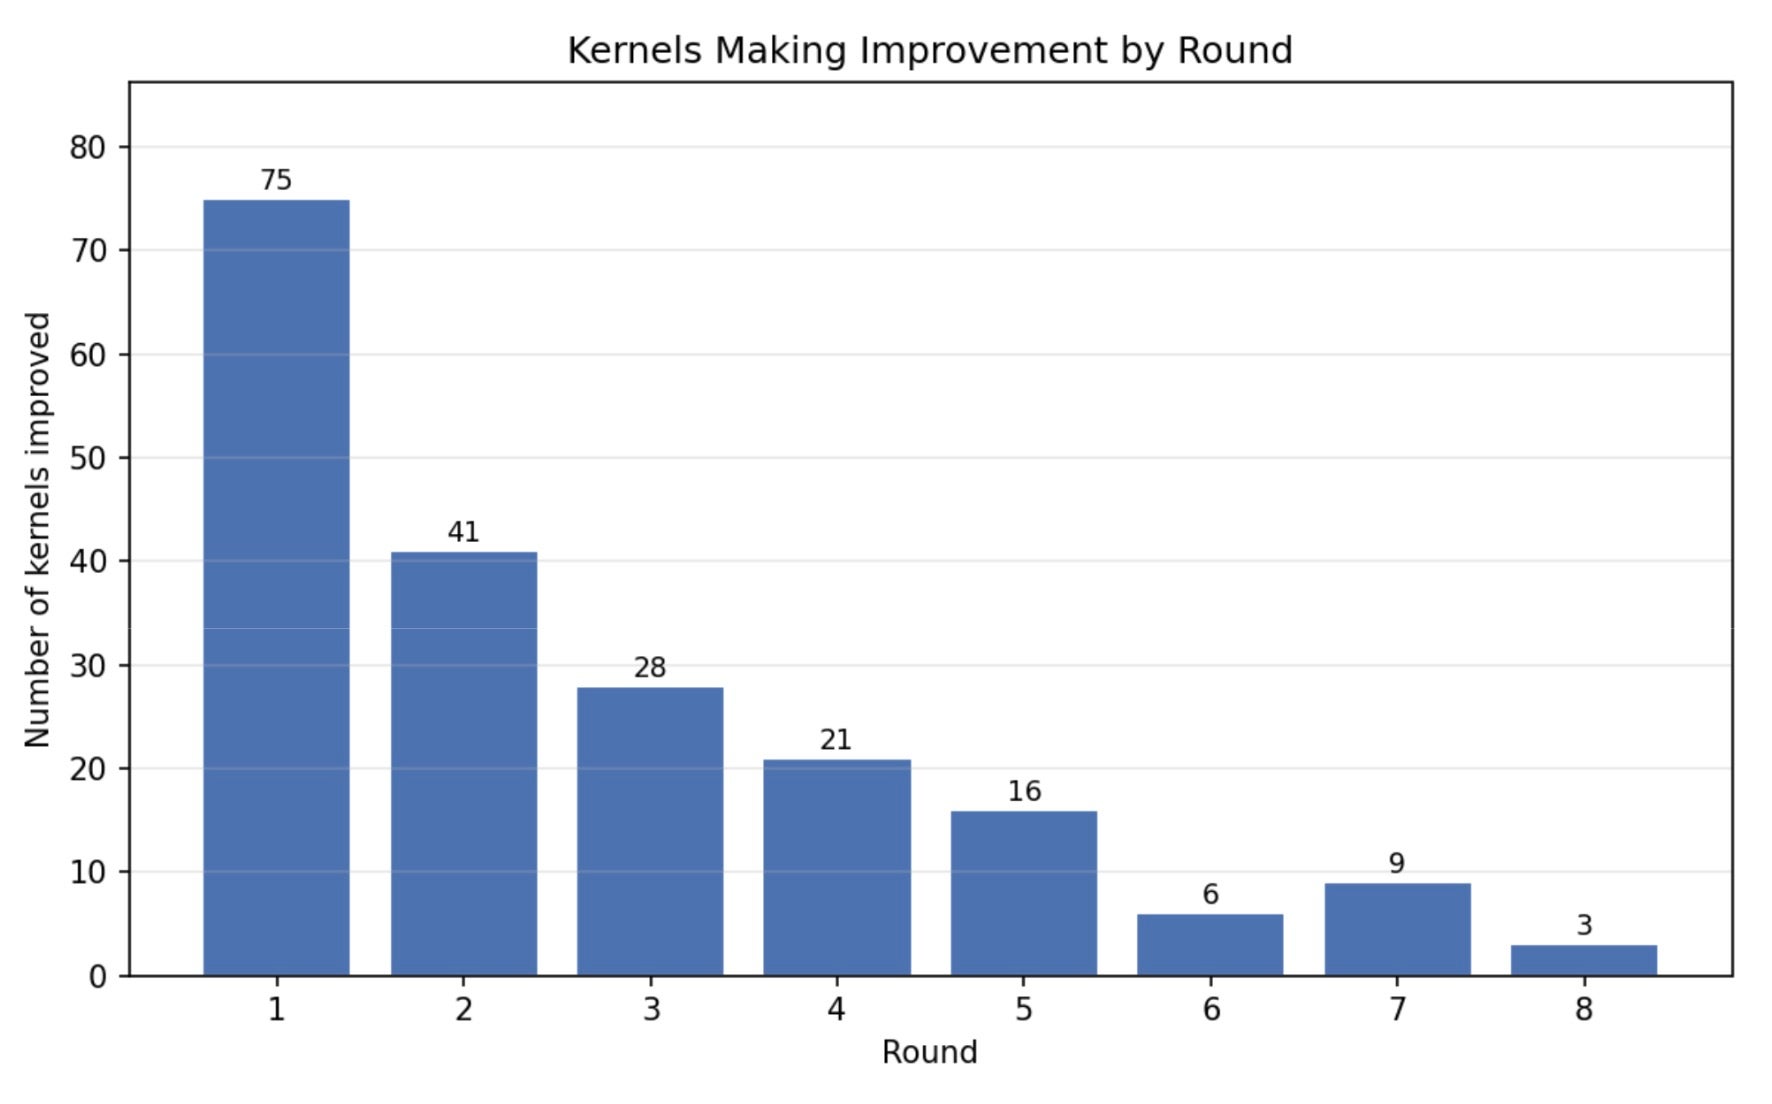
Figure 2: KernelAgent’s performance evolves as the number of optimization rounds increases.
While a large fraction of performance gains are realized in the first round, reflecting the effectiveness of hardware-guided diagnosis and coarse-grained fixes, the system continues to make steady progress with additional rounds. As more rounds are allowed, KernelAgent is able to hill climb beyond the initial improvements, refining earlier optimizations and exploring secondary bottlenecks that only become visible after the primary ones are addressed. This behavior highlights the importance of iterative, feedback-driven optimization.
Below, we present one end-to-end case study to better understand what optimization techniques KernelAgent is learning and applying in different rounds.
Case Study: Matrix–Vector Multiplication (A @ x)
Operation: C = A @ x
Shape: M=2048, K=1,048,576
DTypes: BF16 inputs, FP32 accumulate, BF16 output
Hardware: H100
Results overview:
PyTorch Compile baseline: 2.09 ms
KernelAgent with correctness-only pipeline: 9.52 ms
LLM baseline: direct prompt without hardware feedback. Each round takes the previous round’s output as input: (sequential exploration, 8 rounds, opus-4.5). Best result: 3.1985ms
KernelAgent with optimization layer (4 workers, 8 rounds, opus-4.5). Best results 1.95 ms:
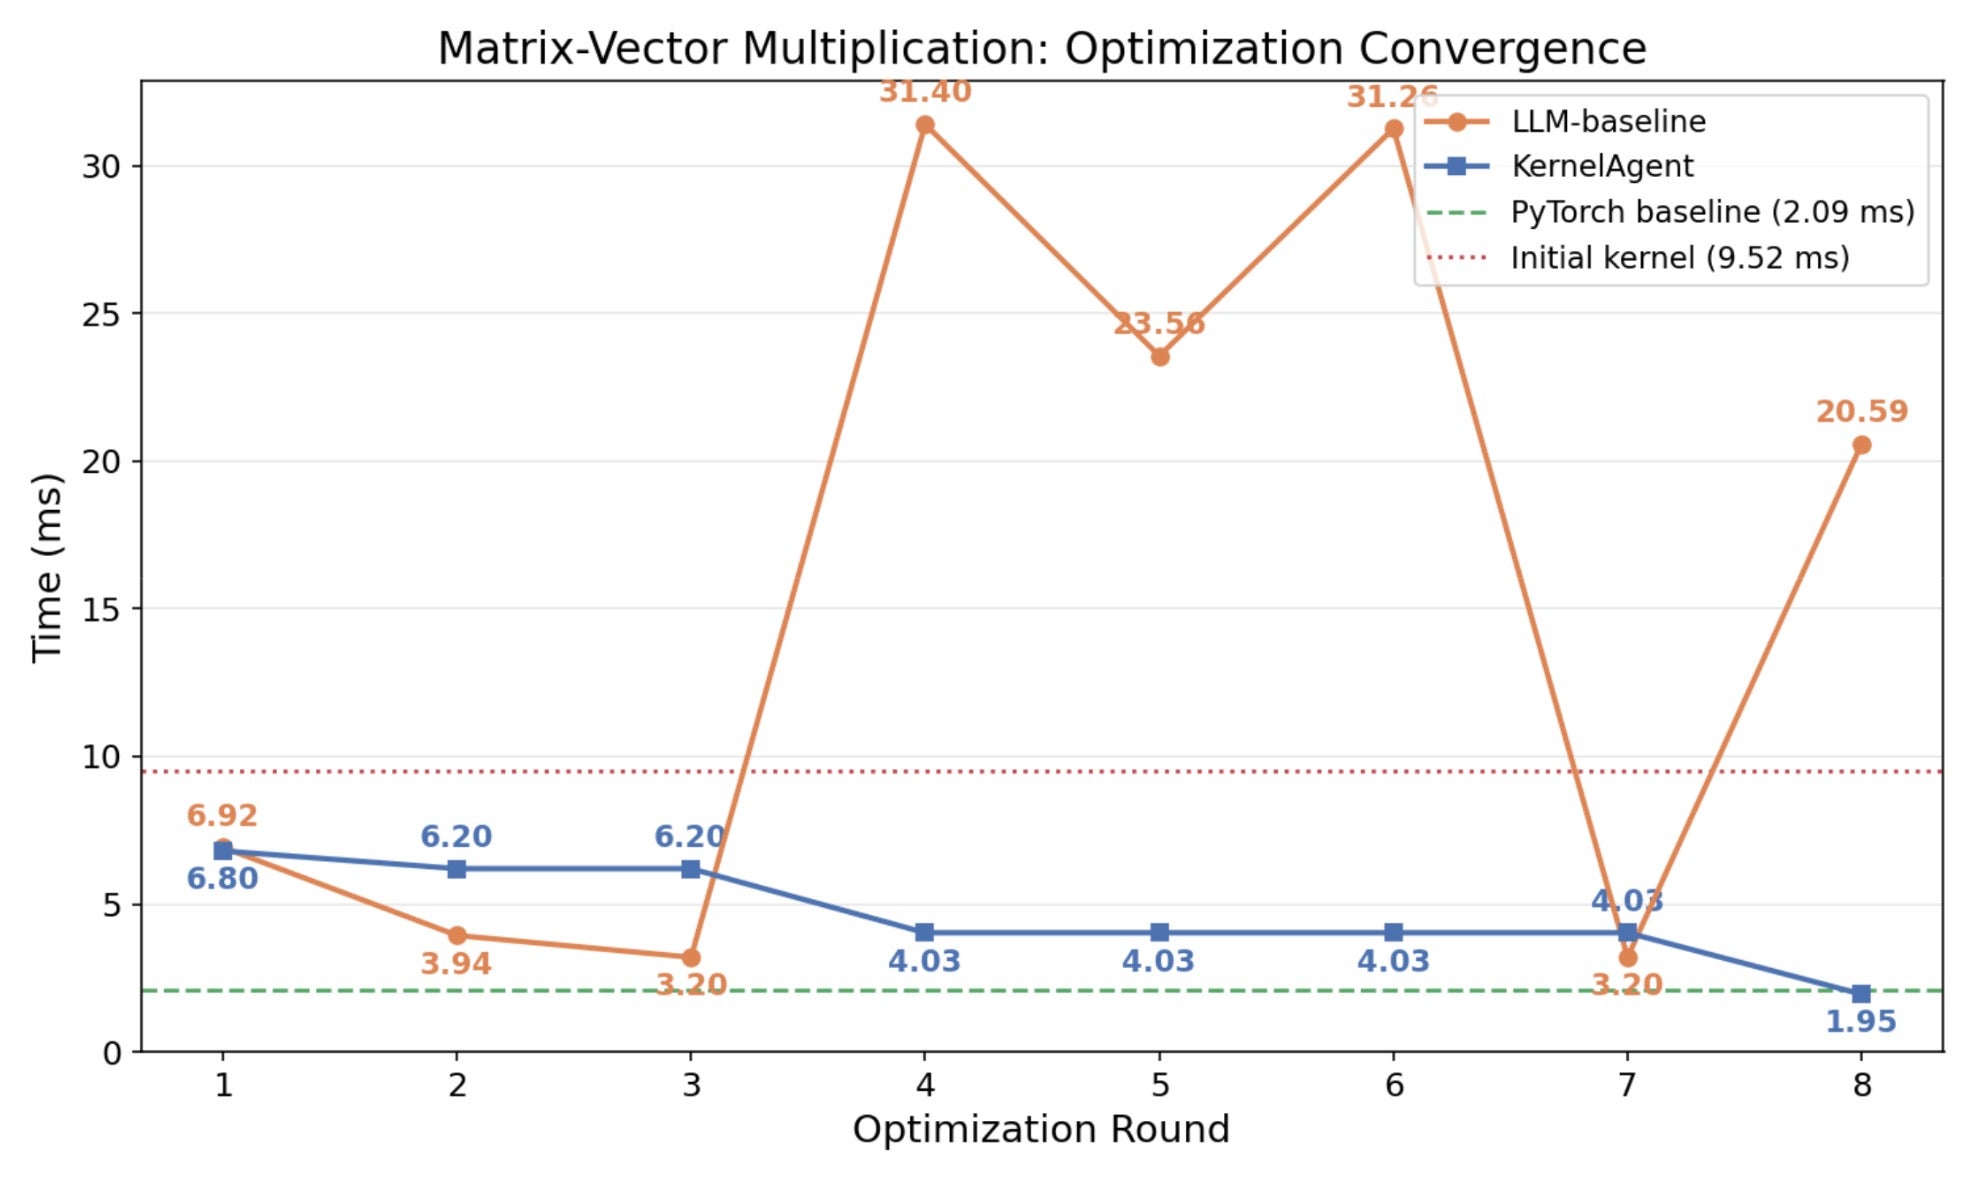
Figure 3: Round-by-round kernel performance: KernelAgent with optimization layer vs. Direct prompt without hardware feedback for matrix-vector multiplication
Key insights:
- The heuristics optimization knowledge in an LLM is effective, for example, “bigger blocks improve bandwidth”. Without performance feedback, however, these heuristics bring the kernel to a local minima and become ineffective as the LLM can’t perceive the performance tradeoff curve it’s navigating.
- Without structured exploration, the LLM is trapped in the trajectory of the seed kernel. It never considered switching from split-K to a simpler one-row-per-thread design and couldn’t outperform performance of eager.
- KernelAgent’s multi-worker exploration, profiling-based approach, and reflective knowledge sharing enable the exploration of different alternatives and find the optimized path.
Why the Baseline Was Slow: The initial Triton kernel used a 2D tile with a vector accumulator. Profiling showed the kernel was primarily occupancy-limited by registers, so it couldn’t issue enough concurrent memory requests to hide DRAM latency.
First improvement identified by KernelAgent:
- Bottleneck: Underutilized SMs due to register-pressure–limited occupancy.
- Prescription: Replace the large vector accumulator with scalar accumulators, process a small number of rows per program, and increase grid parallelism
- Performance: 9.52 ms → 6.80 ms. Occupancy increased 8x, Memory SOL rose from 18.5% → 25.8%.
- Reflexion: Reducing register state is necessary before any other optimization can take effect.
# NUM_ROWS=4: four scalar accumulators instead of a vector
acc0 = 0.0
acc1 = 0.0
acc2 = 0.0
acc3 = 0.0

for k0 in range(0, K, BLOCK_K):
    # Load B vector tile once [BLOCK_K]
    b = tl.load(b_ptrs, mask=k_mask, other=0.0).to(tl.float32)

    # Process each row individually with its own 1D load
    if row_start + 0 < M:
        a0 = tl.load(a_ptr + (row_start + 0) * stride_am + offs_k * stride_ak,
                      mask=k_mask, other=0.0).to(tl.float32)
        acc0 += tl.sum(a0 * b)
    if row_start + 1 < M:
        a1 = tl.load(a_ptr + (row_start + 1) * stride_am + offs_k * stride_ak,
                      mask=k_mask, other=0.0).to(tl.float32)
        acc1 += tl.sum(a1 * b)
    # ... (acc2, acc3 similar)

# Launch config: BLOCK_K=512, NUM_ROWS=4, num_warps=4, num_stages=4
# Grid: (cdiv(M, 4),) = (512,)
Second improvement identified by KernelAgent:
- Bottleneck: Still dominated by memory latency; improvements plateaued.
- Prescription: Introduce limited caching / reuse for the vector x, reducing redundant global memory traffic. Avoid increasing num_stages, which had previously increased register pressure.
- Performance: 6.80 ms → 6.20 ms. A modest gain from shared memory caching for the B vector, reducing redundant global memory accesses
- Reflexion: Matrix–vector multiplication behaves very differently from GEMM; tiling strategies do not transfer directly.
Third improvement identified by KernelAgent:
- Bottleneck: After reducing register pressure, performance was limited by inefficient memory transactions, not lack of warps.
- Prescription: Return to vectorized 2D loads for better coalescing, but with careful control of registers: Smaller tile (BLOCK_M=32), Large K tile (BLOCK_K=512), and num_stages=1 to eliminate pipeline register overhead
- Performance: 6.20 ms → 4.03 ms.
- Reflexion: Reducing register state is necessary before any other optimization can take effect.
### Before (Step 1 approach):
```python
# Sequential scalar accumulators, NUM_ROWS=4
acc0 = 0.0; acc1 = 0.0; acc2 = 0.0; acc3 = 0.0
# ...process rows one at a time with branching...
```

@triton.jit
def matvec_kernel(A_ptr, x_ptr, C_ptr, M, K, stride_am, stride_ak,
                  BLOCK_SIZE_M: tl.constexpr, BLOCK_SIZE_K: tl.constexpr):
    pid_m = tl.program_id(0)
    row_start = pid_m * BLOCK_SIZE_M
    row_offsets = row_start + tl.arange(0, BLOCK_SIZE_M)
    row_mask = row_offsets < M

    # Back to vector accumulator, but only 32 elements (not 128)
    acc = tl.zeros((BLOCK_SIZE_M,), dtype=tl.float32)

    for k_start in range(0, K, BLOCK_SIZE_K):
        k_offsets = k_start + tl.arange(0, BLOCK_SIZE_K)
        k_mask = k_offsets < K

        x_vals = tl.load(x_ptr + k_offsets, mask=k_mask, other=0.0)
        a_ptrs = A_ptr + row_offsets[:, None] * stride_am + k_offsets[None, :] * stride_ak
        a_vals = tl.load(a_ptrs, mask=row_mask[:, None] & k_mask[None, :], other=0.0)
        acc += tl.sum(a_vals.to(tl.float32) * x_vals.to(tl.float32)[None, :], axis=1)

    tl.store(C_ptr + row_offsets, acc.to(tl.bfloat16), mask=row_mask)

# Launch: BLOCK_SIZE_M=32, BLOCK_SIZE_K=512, num_stages=1, num_warps=4
# Grid: (cdiv(M, 32),) = (64,)
Final improvement: one-row-per-program (architectural shift) to saturate bandwidth
- Bottleneck: Underutilized SMs due to register-pressure–limited occupancy.
- Prescription: Make an architectural change: assign one row per program. Scalar accumulator (minimal registers), Massive grid parallelism (2048 programs), Pure 1D streaming loads, and Large BLOCK_K to amortize loop overhead
- Performance: 4.03 ms → 1.95 ms. Warp active ~95%
- Reflexion: This workload is fundamentally memory-bandwidth bound. Maximizing occupancy and parallelism is more important than tiling elegance. Architectural changes are sometimes required to escape local optima.
@triton.jit
def matvec_kernel(A_ptr, x_ptr, C_ptr, M, K, stride_am, stride_ak,
                  BLOCK_SIZE_K: tl.constexpr):
    pid_m = tl.program_id(0)
    if pid_m >= M:
        return

    # Scalar accumulator --- minimal register usage
    acc = 0.0
    a_row_ptr = A_ptr + pid_m * stride_am

    num_k_blocks = tl.cdiv(K, BLOCK_SIZE_K)
    for k_block in range(num_k_blocks):
        k_start = k_block * BLOCK_SIZE_K
        k_offsets = k_start + tl.arange(0, BLOCK_SIZE_K)
        k_mask = k_offsets < K

        x_vals = tl.load(x_ptr + k_offsets, mask=k_mask, other=0.0)
        a_vals = tl.load(a_row_ptr + k_offsets * stride_ak, mask=k_mask, other=0.0)

        prod = a_vals.to(tl.float32) * x_vals.to(tl.float32)
        block_sum = tl.sum(prod, axis=0)  # Scalar reduction
        acc += block_sum

    tl.store(C_ptr + pid_m, acc.to(tl.bfloat16))

# Launch: BLOCK_SIZE_K=1024, grid=(M,) = (2048,)
# No explicit num_warps or num_stages (defaults)
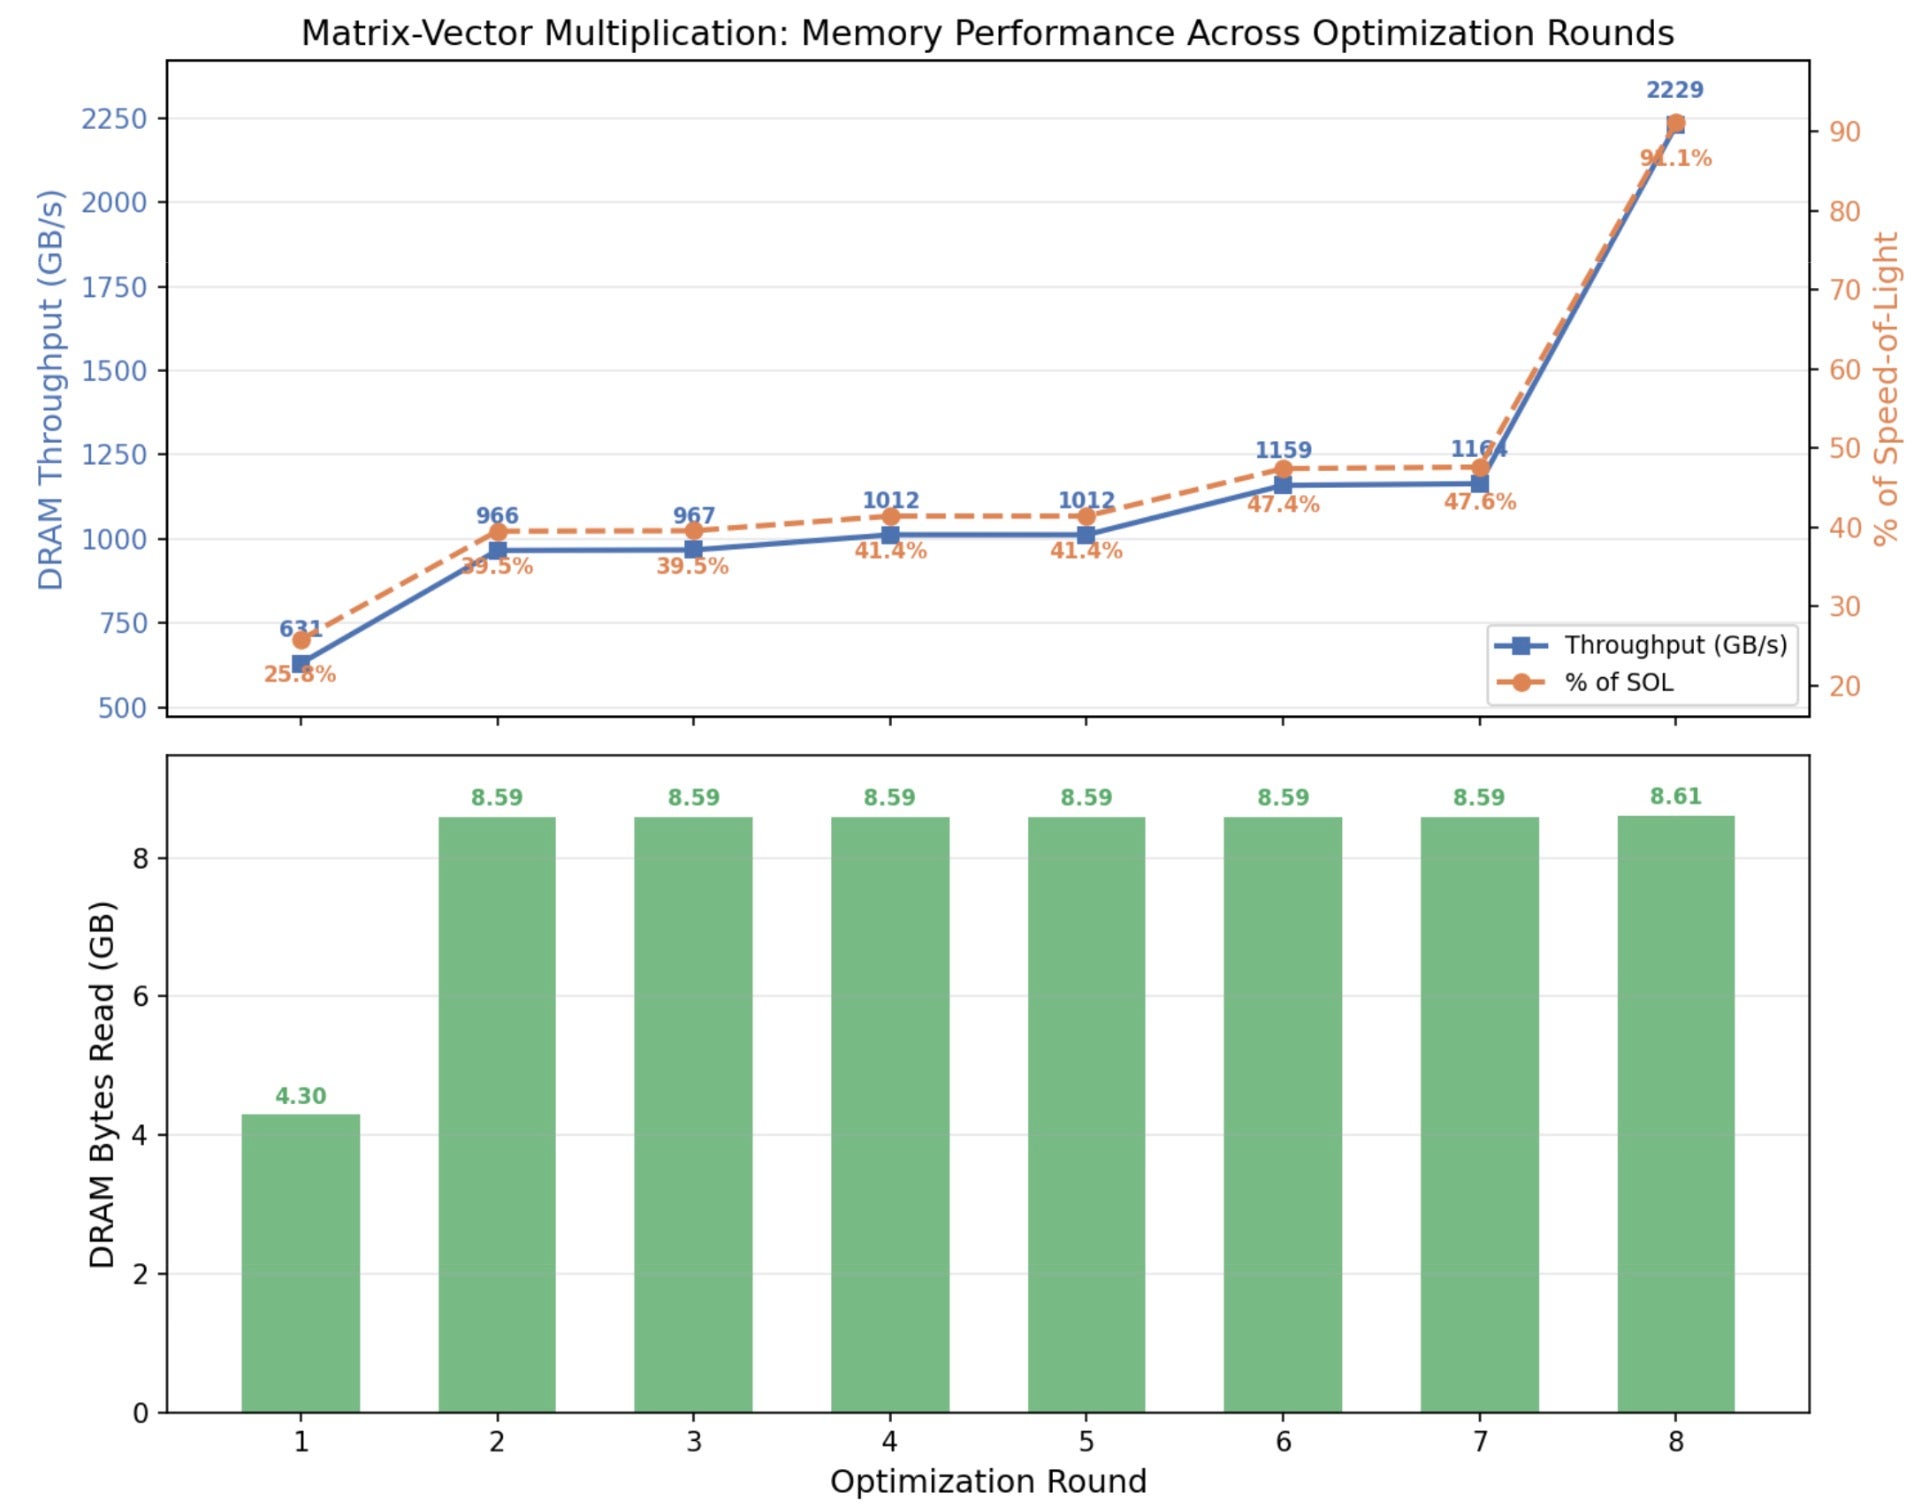
Figure 4: Memory throughput achieved (in GB/s and % of SOL) through KernelAgent’s Improvement
Lessons Learned
We would like to share our learnings when orchestrating multiple agents tackle complicated kernel engineering questions.
Q: How to keep agents on track without human oversights?
The key is to have hard, verifiable constraints. In KernelAgent, correctness and performance are enforced through gated evaluation. Every kernel variant must pass numerical verification, and performance is measured using real hardware benchmarks. Agents stay on track when progress is defined by executable, measurable outcomes
Q: How to structure work so multiple agents can make progress in parallel, yet sharing the working context with each other so that future rounds of iteration will build on the shared memory?
Parallelism alone is not sufficient; without coordination, agents quickly duplicate work or explore redundant paths. Within each round, optimization workers operate independently and in parallel, exploring different optimization strategies. After the round completes, their outcomes—successful or not—are summarized into a shared, structured context that captures what was attempted, what worked, and why. This shared memory is then broadcast to all agents in subsequent rounds.
Q: How to prevent the agents stuck in a local minimum, and clear signals to know when to stop?
Avoiding local minima requires both diversity in exploration and clear termination criteria. KernelAgent maintains a beam of top-performing kernels rather than a single incumbent. Parallel exploration further reduces the risk that early suboptimal decisions dominate the search.
Specific to GPU optimization, it can be stuck in sequential parameter optimization. While optimization A didn’t work and optimization B didn’t work, when combined together, it’s possible to see a performance breakthrough. The goal for KernelAgent is thus to maximize the exploration of ideas that can be proposed.
KernelAgent monitors performance deltas and hardware utilization metrics. When successive rounds fail to produce meaningful improvements in roofline efficiency or runtime, the system concludes that further optimization is unlikely to yield returns.
Conclusion
KernelAgent demonstrates that the deep agent principles from the previous correctness-focused loop, including grounded tool use, parallel exploration, deterministic control, extend naturally to performance optimization. By adding hardware profiling and working memory to the loop, allowing multi-agent to learn and explore different optimization paths, we can push verified kernels from “correct” to “correct and fast.”
Try it yourself. KernelAgent is an open-source project under active development. We welcome feedback, contributions, and new use cases from the community, and we hope this work helps advance practical, scalable kernel optimization within the PyTorch ecosystem.
Acknowledgements
We would also like to thank the following people for feedback: Paulius Micikevicius, Yang Wang, Lu Fang, Jie Liu, Zacharias Fisches, Alec Hammond, Richard Li, Chris Gottbrath, Davide Italiano, Joe Spisak, and John Myles White.