Understanding CUDA Memory Usage
To debug CUDA memory use, PyTorch provides a way to generate memory snapshots that record the state of allocated CUDA memory at any point in time, and optionally record the history of allocation events that led up to that snapshot.
The generated snapshots can then be drag and dropped onto the interactiver viewer hosted at pytorch.org/memory_viz which can be used to explore the snapshot.
Generating a Snapshot
The common pattern for recording a snapshot is to enable memory history, run the code to be observed, and then save a file with a pickled snapshot:
# enable memory history, which will
# add tracebacks and event history to snapshots
torch.cuda.memory._record_memory_history()

run_your_code()
torch.cuda.memory._dump_snapshot("my_snapshot.pickle")
Using the visualizer
Open pytorch.org/memory_viz and drag/drop the pickled snapshot file into the visualizer. The visualizer is a javascript application that runs locally on your computer. It does not upload any snapshot data.
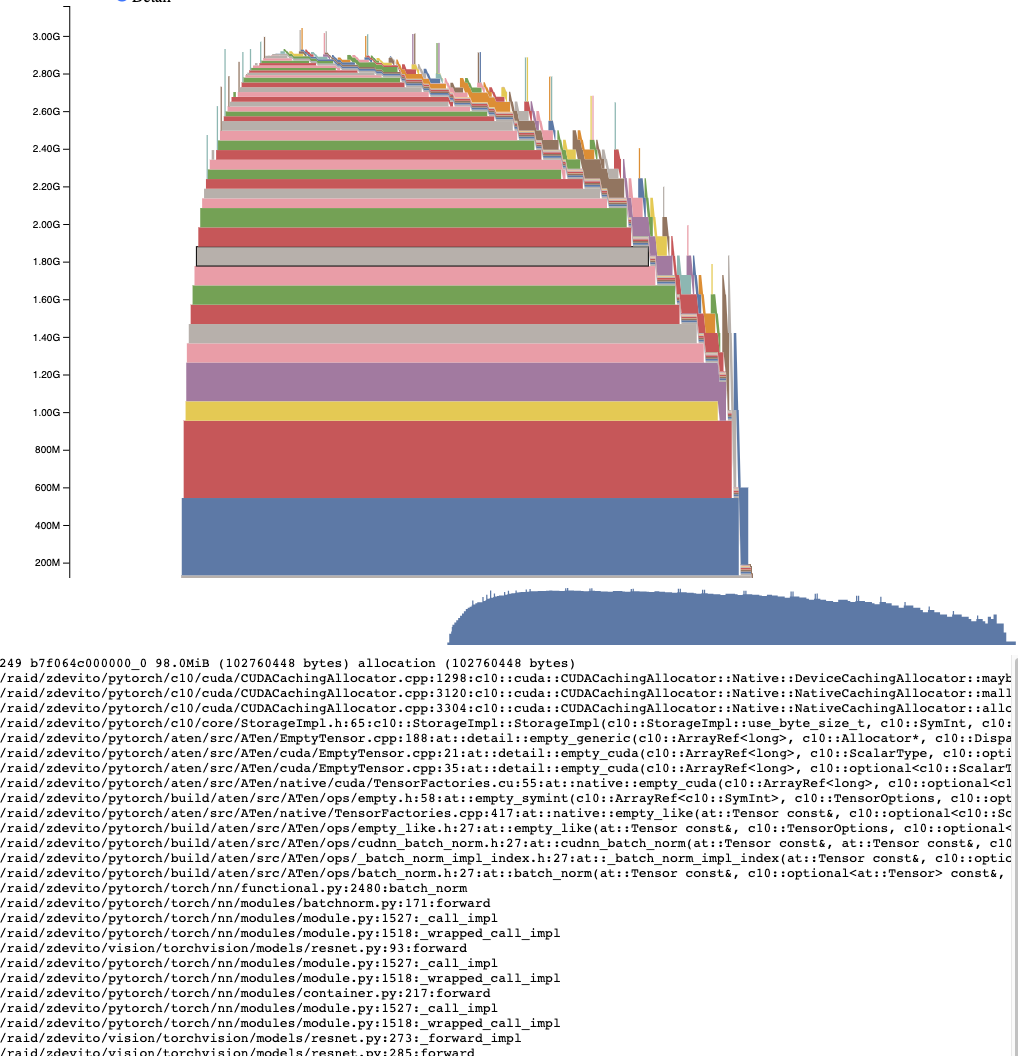
Active Memory Timeline
The Active Memory Timeline shows all the live tensors over time in the snapshot on a particular GPU. Pan/Zoom over the plot to look at smaller allocations. Mouse over allocated blocks to see a stack trace for when that block was allocated, and details like its address. The detail slider can be adjusted to render fewer allocations and improve performance when there is a lot of data.
Allocator State History
The Allocator State History shows individual allocator events in a timeline on the left. Select an event in the timeline to see a visual summary of the allocator state at that event. This summary shows each individual segment returned from cudaMalloc and how it is split up into blocks of individual allocations or free space. Mouse over segments and blocks to see the stack trace when the memory was allocated. Mouse over events to see the stack trace when the event occurred, such as when a tensor was freed. Out of memory errors are reported as OOM events. Looking at the state of memory during an OOM may provide insight into why an allocation failed even though reserved memory still exists.
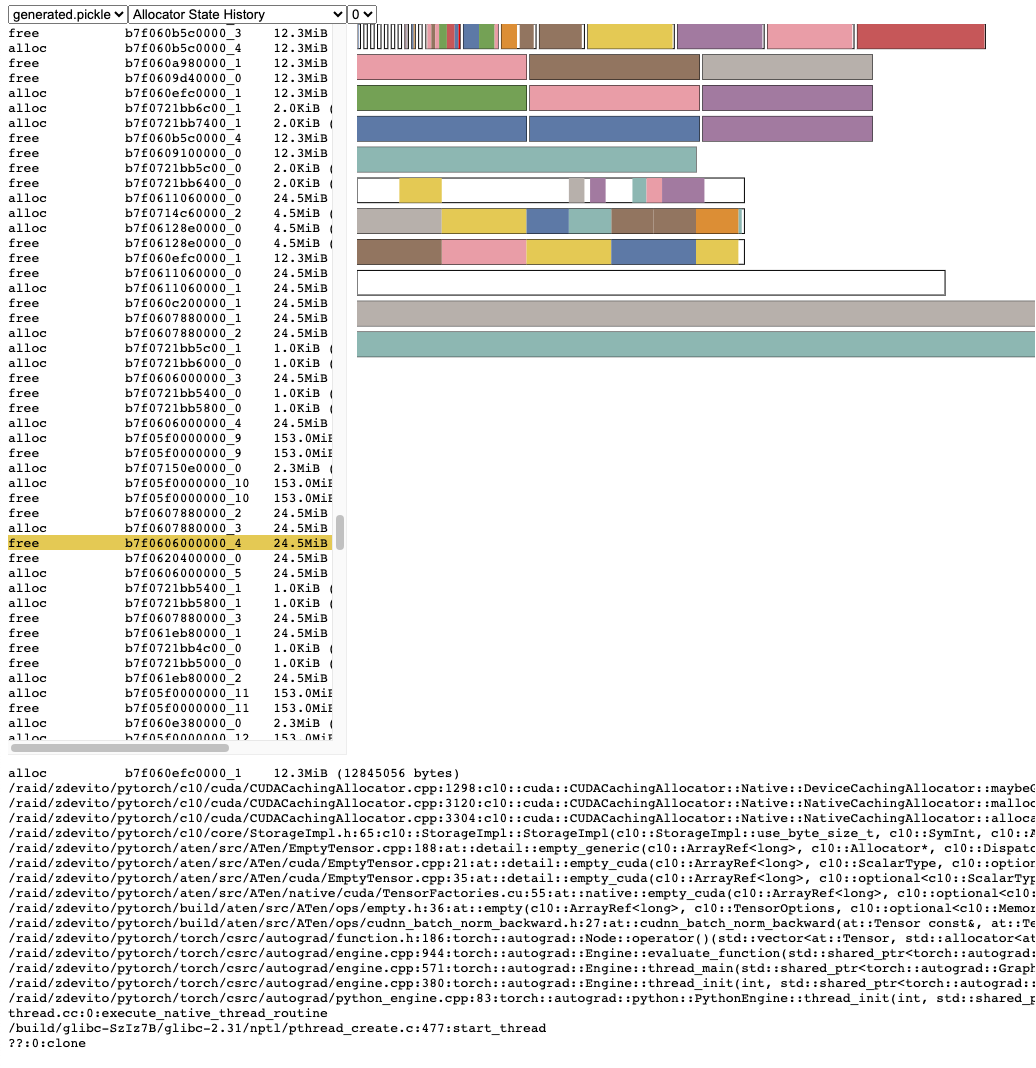
The stack trace information also reports the address at which an allocation occurred. The address b7f064c000000_0 refers to the (b)lock at address 7f064c000000 which is the “_0”th time this address was allocated. This unique string can be looked up in the Active Memory Timeline and searched in the Active State History to examine the memory state when a tensor was allocated or freed.
Snapshot API Reference
- torch.cuda.memory._record_memory_history(enabled='all', context='all', stacks='all', max_entries=9223372036854775807, device=None)[source]
Enable recording of stack traces associated with memory allocations, so you can tell what allocated any piece of memory in
torch.cuda.memory._snapshot().In addition too keeping stack traces with each current allocation and free, this will also enable recording of a history of all alloc/free events.
Use
torch.cuda.memory._snapshot()to retrieve this information, and the tools in _memory_viz.py to visualize snapshots.The Python trace collection is fast (2us per trace), so you may consider enabling this on production jobs if you anticipate ever having to debug memory issues.
C++ trace collection is also fast (~50ns/frame), which for many typical programs works out to ~2us per trace, but can vary depending on stack depth.
- Parameters
enabled (Literal[None, "state", "all"], optional) – None, disable recording memory history. “state”, keep information for currenly allocated memory. “all”, additionally keep a history of all alloc/free calls. Defaults to “all”.
context (Literal[None, "state", "alloc", "all"], optional) – None, Do not record any tracebacks. “state”, Record tracebacks for currently allocated memory. “alloc”, additionally keep tracebacks for alloc calls. “all”, additionally keep tracebacks for free calls. Defaults to “all”.
stacks (Literal["python", "all"], optional) – “python”, include Python, TorchScript, and inductor frames in tracebacks “all”, additionally include C++ frames Defaults to “all”.
max_entries (int, optional) – Keep a maximum of max_entries alloc/free events in the recorded history recorded.
- torch.cuda.memory._snapshot(device=None)[source]
Save a snapshot of CUDA memory state at the time it was called.
The state is represented as a dictionary with the following structure.
class Snapshot(TypedDict):
    segments : List[Segment]
    device_traces: List[List[TraceEntry]]

class Segment(TypedDict):
    # Segments are memory returned from a cudaMalloc call.
    # The size of reserved memory is the sum of all Segments.
    # Segments are cached and reused for future allocations.
    # If the reuse is smaller than the segment, the segment
    # is split into more then one Block.
    # empty_cache() frees Segments that are entirely inactive.
    address: int
    total_size: int #  cudaMalloc'd size of segment
    stream: int
    segment_type: Literal['small', 'large'] # 'large' (>1MB)
    allocated_size: int # size of memory in use
    active_size: int # size of memory in use or in active_awaiting_free state
    blocks : List[Block]

class Block(TypedDict):
    # A piece of memory returned from the allocator, or
    # current cached but inactive.
    size: int
    requested_size: int # size requested during malloc, may be smaller than
                        # size due to rounding
    address: int
    state: Literal['active_allocated', # used by a tensor
                'active_awaiting_free', # waiting for another stream to finish using
                                        # this, then it will become free
                'inactive',] # free for reuse
    frames: List[Frame] # stack trace from where the allocation occurred

class Frame(TypedDict):
        filename: str
        line: int
        name: str

class TraceEntry(TypedDict):
    # When `torch.cuda.memory._record_memory_history()` is enabled,
    # the snapshot will contain TraceEntry objects that record each
    # action the allocator took.
    action: Literal[
    'alloc'  # memory allocated
    'free_requested', # the allocated received a call to free memory
    'free_completed', # the memory that was requested to be freed is now
                    # able to be used in future allocation calls
    'segment_alloc', # the caching allocator ask cudaMalloc for more memory
                    # and added it as a segment in its cache
    'segment_free',  # the caching allocator called cudaFree to return memory
                    # to cuda possibly trying free up memory to
                    # allocate more segments or because empty_caches was called
    'oom',          # the allocator threw an OOM exception. 'size' is
                    # the requested number of bytes that did not succeed
    'snapshot'      # the allocator generated a memory snapshot
                    # useful to coorelate a previously taken
                    # snapshot with this trace
    ]
    addr: int # not present for OOM
    frames: List[Frame]
    size: int
    stream: int
    device_free: int # only present for OOM, the amount of
                    # memory cuda still reports to be free
- Returns
The Snapshot dictionary object
- torch.cuda.memory._dump_snapshot(filename='dump_snapshot.pickle')[source]
Save a pickled version of the torch.memory._snapshot() dictionary to a file.
This file can be opened by the interactive snapshot viewer at pytorch.org/memory_viz
- Parameters
filename (str, optional) – Name of the file to create. Defaults to “dump_snapshot.pickle”.
